Using Model
Once the process is complete, the model can be opened directly in SINCAL. The export process builds a SINCAL version model according to what is selected in the Target Version in the exporter, so you will get a dialog box asking you to confirm the upgrade if you are exporting older version and running a more recent version of SINCAL. If you are running an earlier version of SINCAL, the model will not load.
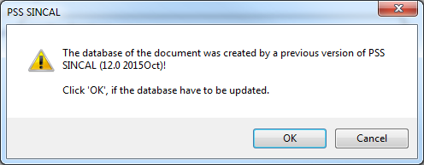
After pressing the OK button, the model should load successfully, and a schematic display similar to the screen shot below should be produced.
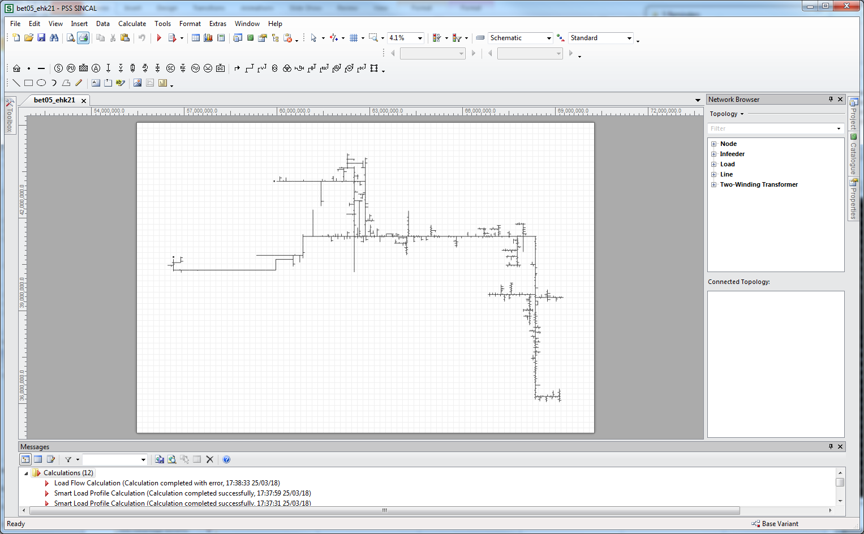
Note that the declutter functions in the DMS do not apply to the SINCAL user interface, and so all of the network will be visible at all zoom levels.
A smart load flow can now be run to perform a smart load analysis. For more info, refer to the instructions section of the Smart Load Analysis documentation.
Transformers are converted to loads. The P & Q values will be set according to the options selected in the Power Export preferences.
HV customers are also be included as load points, and load data from these is obtained from the Smart Load Server as well.
Regulators are modelled as two winding transformers with a vector group of D0.
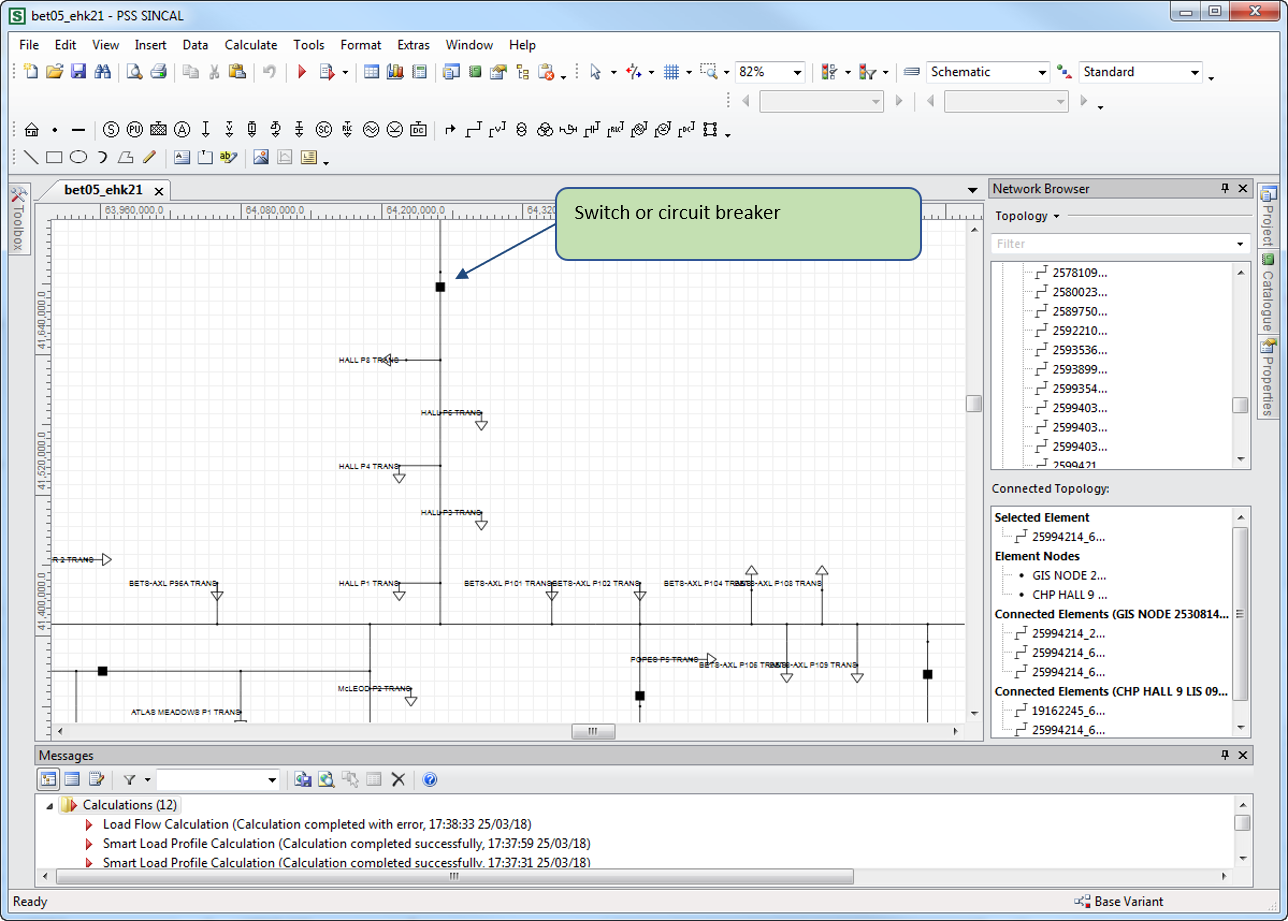
Switches and Circuit breakers are included in the model, as illustrated below. If the device is normally open, it will be exported in that state.
Isolation transformers are modelled as either two winding transformers, or as aggregated load points, depending on the options chosen, as described in the following sections.
Handling of SWER and single-phase network
If the Simplifying SWER option is not picked, SWER is modelled as conductors on the L1 phase, with an isolation transformer connecting two phases on the two or three phase backbone to a single phase SWER line.
The isolation transformer will have its winding set to W1, W2 or W3. The following combinations can be used:
| TX Winding | SWER Line and Load Connection Types | Connected Phases |
|---|---|---|
| W1 | L1 | 1 and 2 |
| W2 | L2 | 2 and 3 |
| W3 | L3 | 1 and 3 |
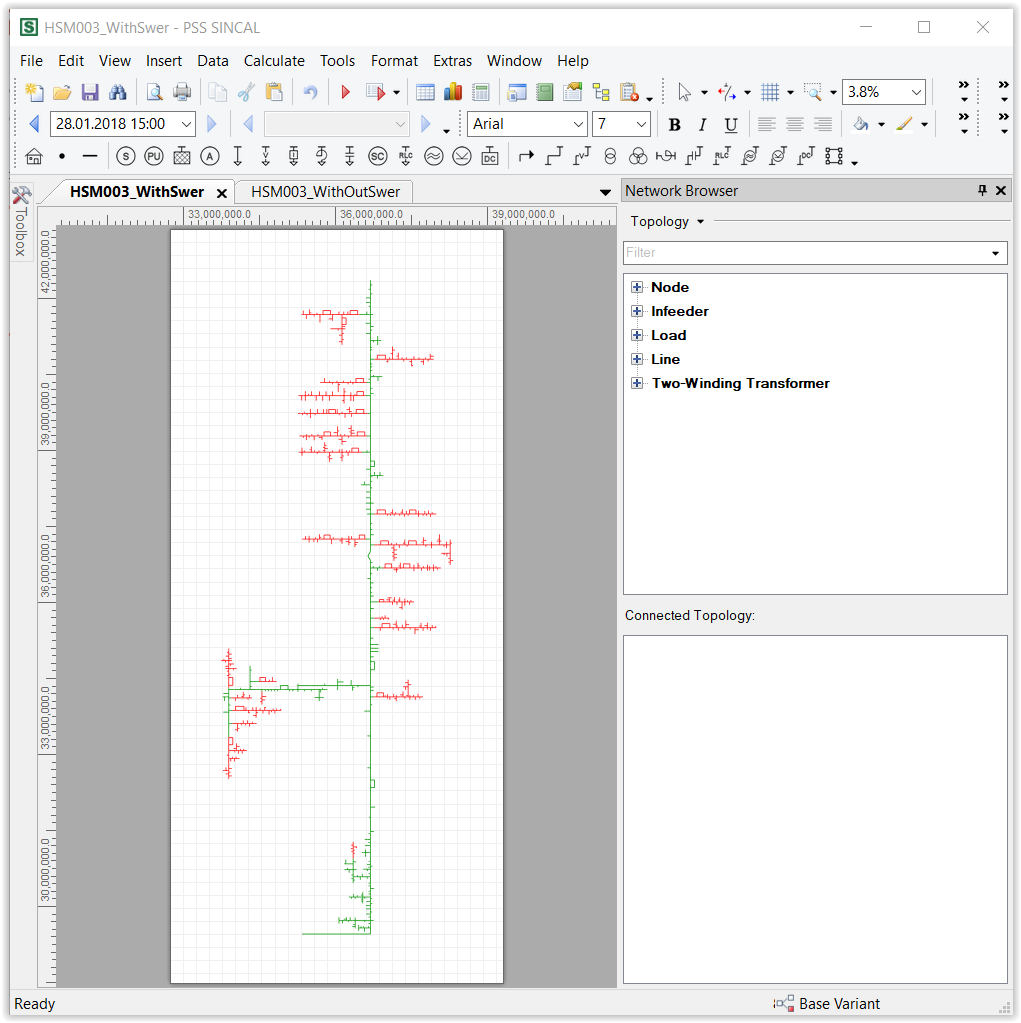
The example below is for HSM003. In the schematic, the green conductors are three phase backbone, the red conductors are SWER.
All elements on the SWER line can be moved to a different phase by following the steps described below.
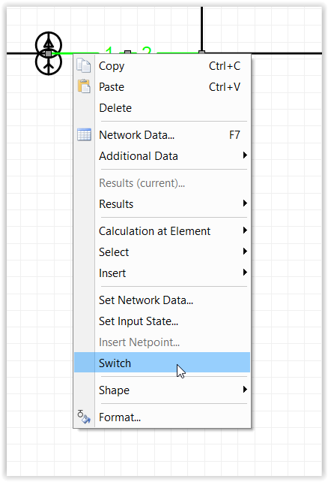
Switch the SWER line at the first conductor from the Isolation transformer by zooming in close and right clicking on the line near the isolation transformer, and then selecting the Switch option, as illustrated below.
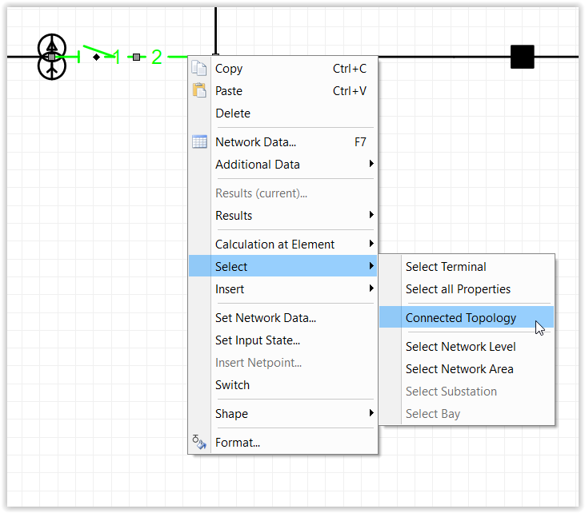
Then right click on the same line and use the Select -> Connected Topology option to select all objects on the SWER line, as illustrated below.
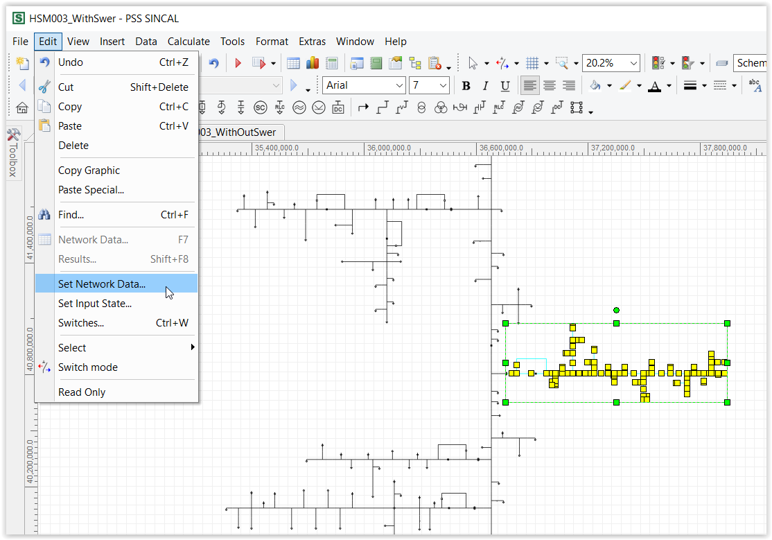
Then with all the assets selected, use the Edit -> Set Network Data option, as illustrated below.
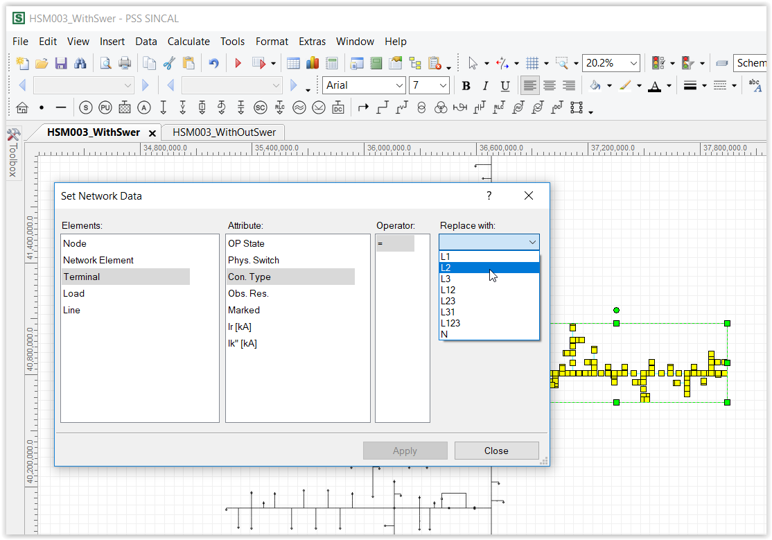
This will allow you to select the Terminal for all objects, and then the Connection Type. This can be used to change the phases the SWER line is connected to. The Isolation winding type will also need to be changed, as per table above.
Simplifying SWER
Simplifying SWER line results in all the connected load downstream of the isolation transformer being turned into an equivalent load, and the Isolation transformer being turned into a load point connected to the 3 phase backbone.
The option is enabled by ticking the Simplify SWER tick box in the exporter, as illustrated below:
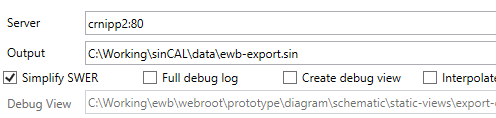
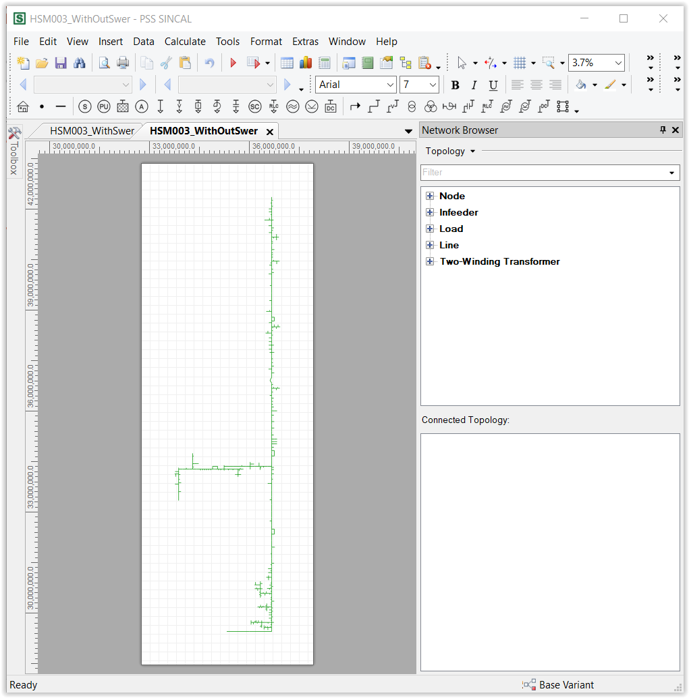
When this option is used with the HSM003 feeder, the result looks like this:
Single phase lines
Single Phase Line means a line that is connected to two phases on a three phase backbone.
The model produced by the SINCAL export utility does not currently model single phase lines. All network lines are modelled as three phase.
Infeeder placement
One infeeder is created for each zone, and is placed at the centre point of all feeder circuit breakers. This can result in some messy looking displays, as illustrated below for BQ zones substation, when all feeders are selected.
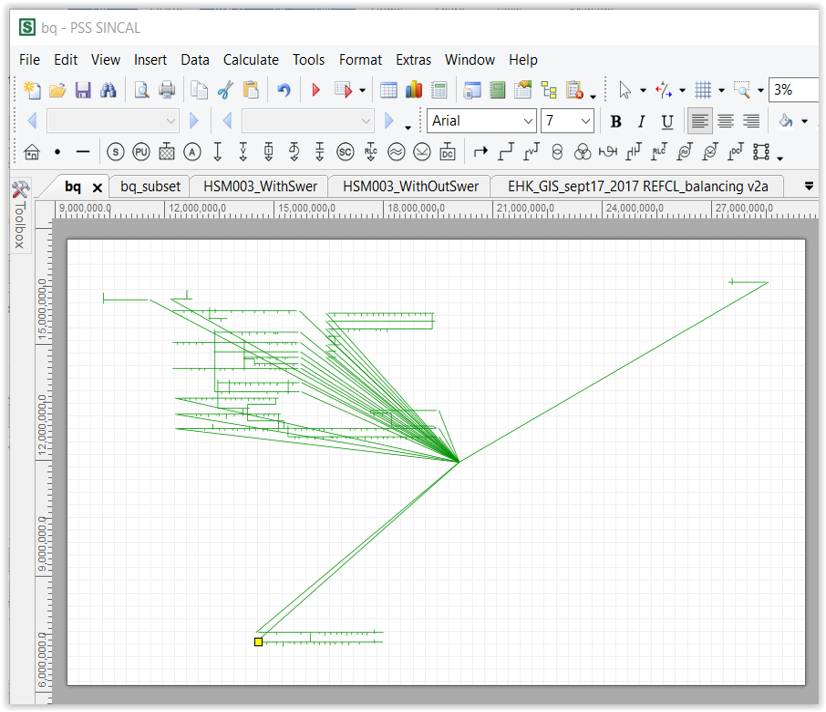
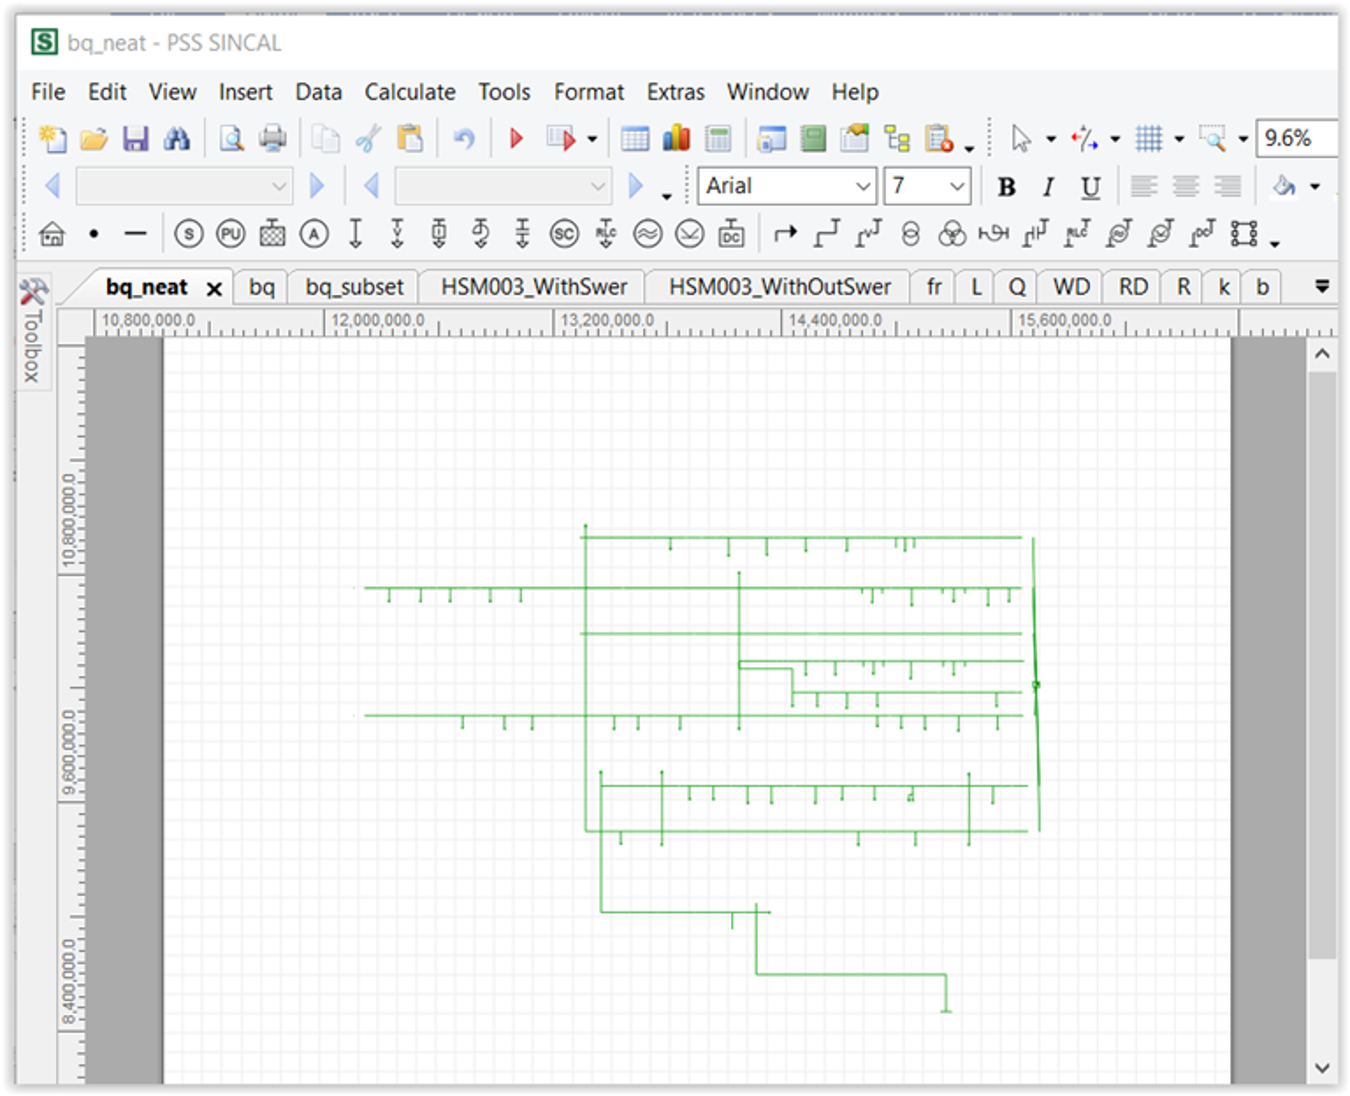
This is because of the way the feeders are laid out in the DMS. In situations like this, the diagram can be made much neater by only selecting only the feeders of interest. For example, if the feeders BQ057, BQ043, BW012, BQ015, BQ014, BQ052, BQ046 and BQ033 are selected from the total available feeders from BQ, the schematic is simplified to something much simpler, as illustrated below:
Missing or Suspicious line data layer
The export tool uses the "Layers group" in the "Evaluations Settings" to display when line type data is missing or suspicious for a line, for both overhead and underground lines.
Line data is considered to be "suspicious" if one of the fields in the GIS used to determine the line code is UNKNOWN.
Additionally, red line is used when the line length is not known.
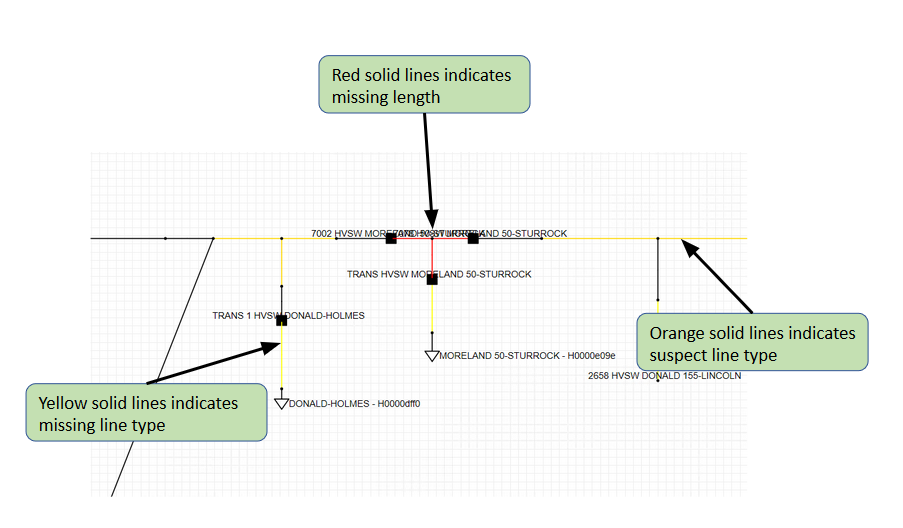
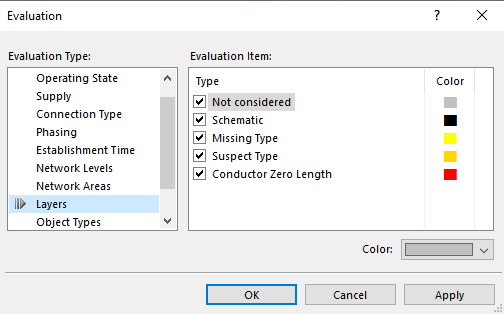
You can change the colour of missing or suspect lines by clicking the evaluation settings to show the Evaluation dialog box.

The length for lines that have an unknown length will be set to 0.
Checking the results
It’s a good idea to check the results of the model and smart load by looking at the feeder head currents from the SCADA system for the same day and time selected in the smart load solution.
Be careful about daylight saving time - all times reported by the smart load profile are in eastern standard time, not day light saving time.
In general terms, the rural and urban networks should give reasonably accurate results, but in some case the CBD load flow results will be missing load due to NMI to supply point mapping issues in the CIS and GIS.
If the results are different, the smart load controller application can be used to moderate the load up or down by a fixed amount for the whole network, or for selected loads in the network.