DMS Plugin
The Energy Workbench DMS plugin allows load data trend lines to be accessed from the DMS diagram displays, in a similar way to trendSCADA, except the selection of load is via assets, instead of analogue values on the display pages.
Most switches, circuit breakers and conductors have a menu added called “Maximum Demand”, as illustrated below. This menu provides three additional options:
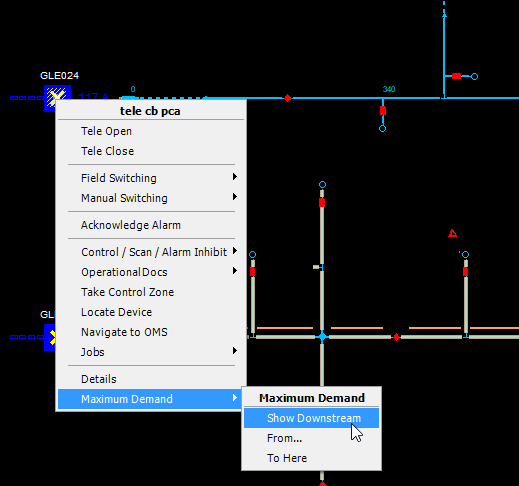
- Show Downstream – this will trace downstream of the selected asset, summating the aggregated load on each distribution transformer, to find the top n co-incident maximum demand days.
- From… this menu option is used to pick a starting asset for trace.
- To Here – is used to pick an ending asset for a trace. The system will trace out the network between the two selected assets, summating aggregated load in the same way as the downstream trace.
Following this, a set of trend lines will be displayed, showing the top 5 maximum demand days for the portion of the network traced. The result will look similar to the screen shots elsewhere in this document for maximum demand trend lines.
note
The results will typically be 10 to 15% lower than the results reported by SCADA, where a comparison is made with telemetry data downstream of the same device.
Troubleshooting
Limitations
In some cases, we cannot tell which transformer a customer is connected to in a multi-transformer site - this is mostly an issue for large CBD transformers. In this case, we spread the load over all the possible transformers the customer can be connected to.