How Measurement Zones Work
Measurement Zones
Solving a power flow model for an entire distribution network produces a lot of results - voltage, current, and power values at every node in the network. Whilst granular node-level results are useful in certain instances (see Node Level Results), this volume of data is generally too large to handle efficiently for large studies - both from a compute perspective (storage costs, running costs, solve time) and a human perspective (too much data to understand and act on meaningfully).
The HCM therefore uses Measurement Zones, which are areas of the network with clear, deterministic boundaries that group assets together and provide metrics at an aggregate level. Measurement zones can be sized differently depending on the level of granularity needed and the type of analysis being done.
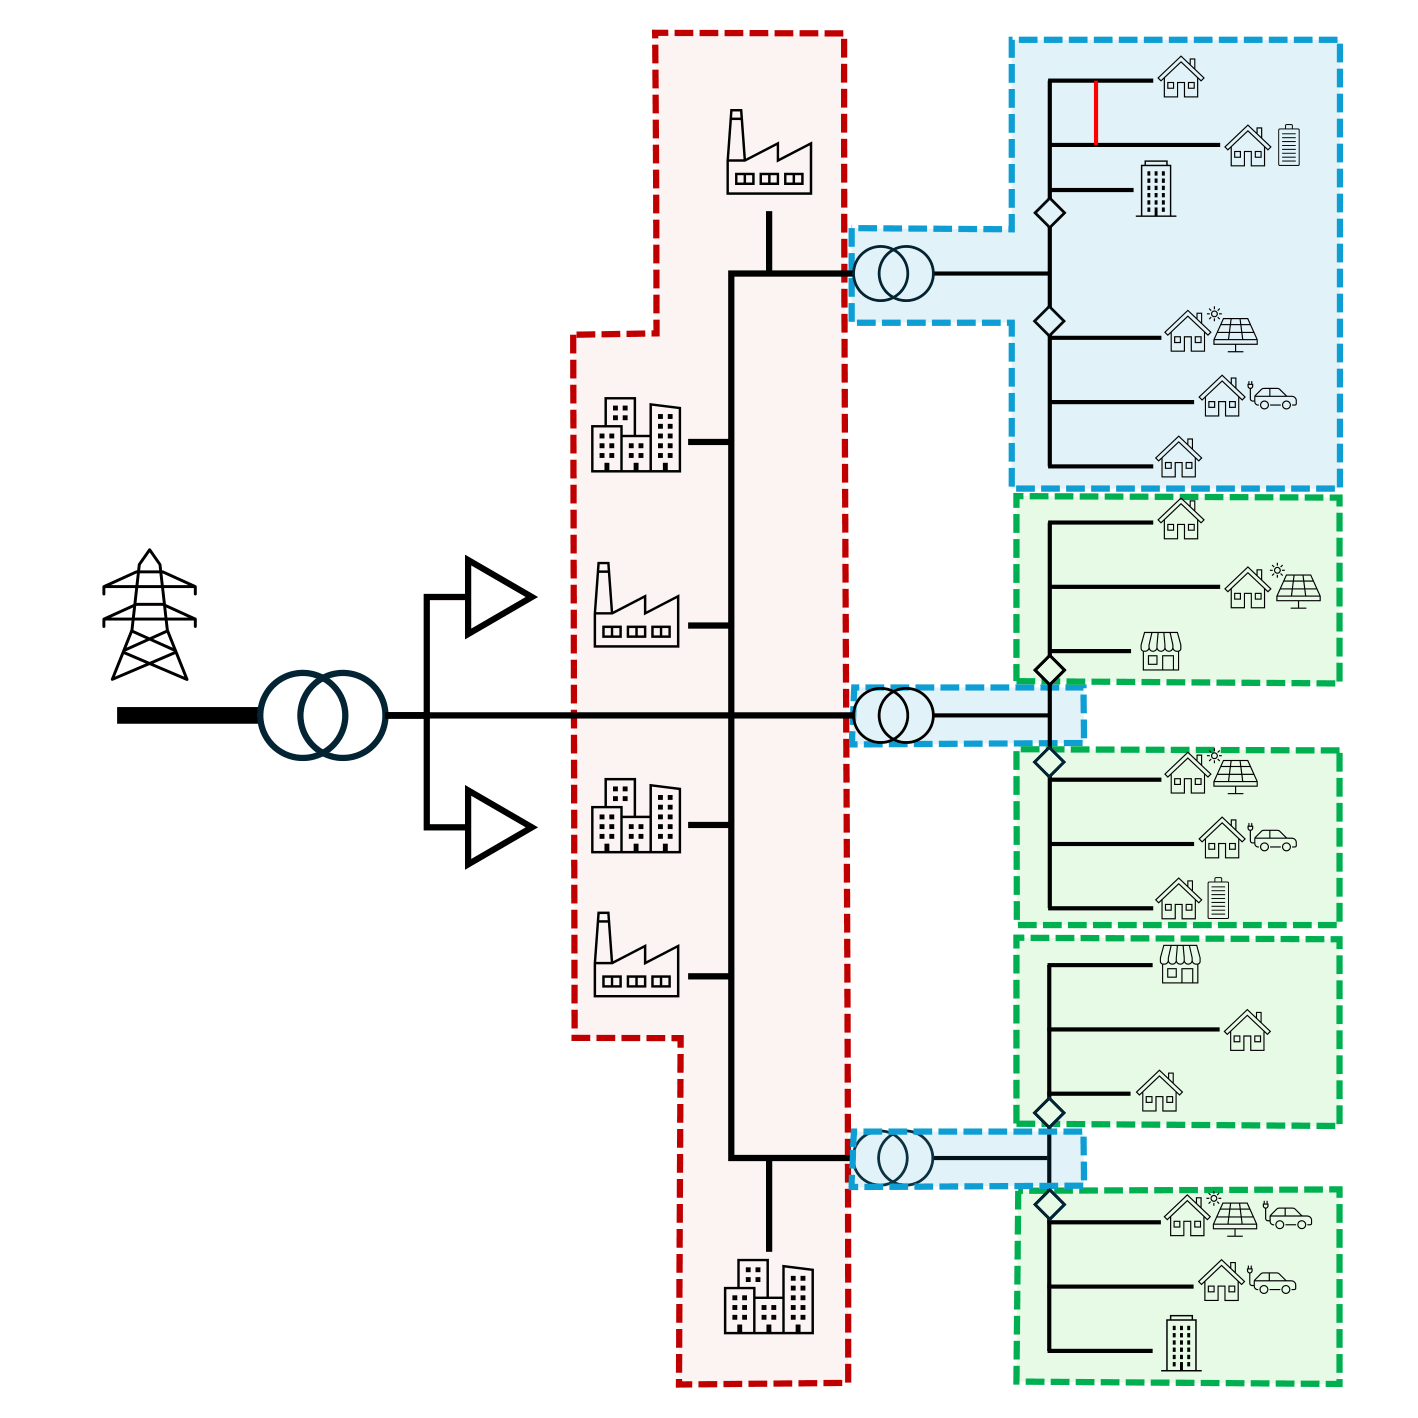
The diagram below shows a schematic of the network with key elements labeled.
The HCM only models the network from the zone substation busbar downward. Transmission, subtransmission, and the internals of the zone substation are not modelled.
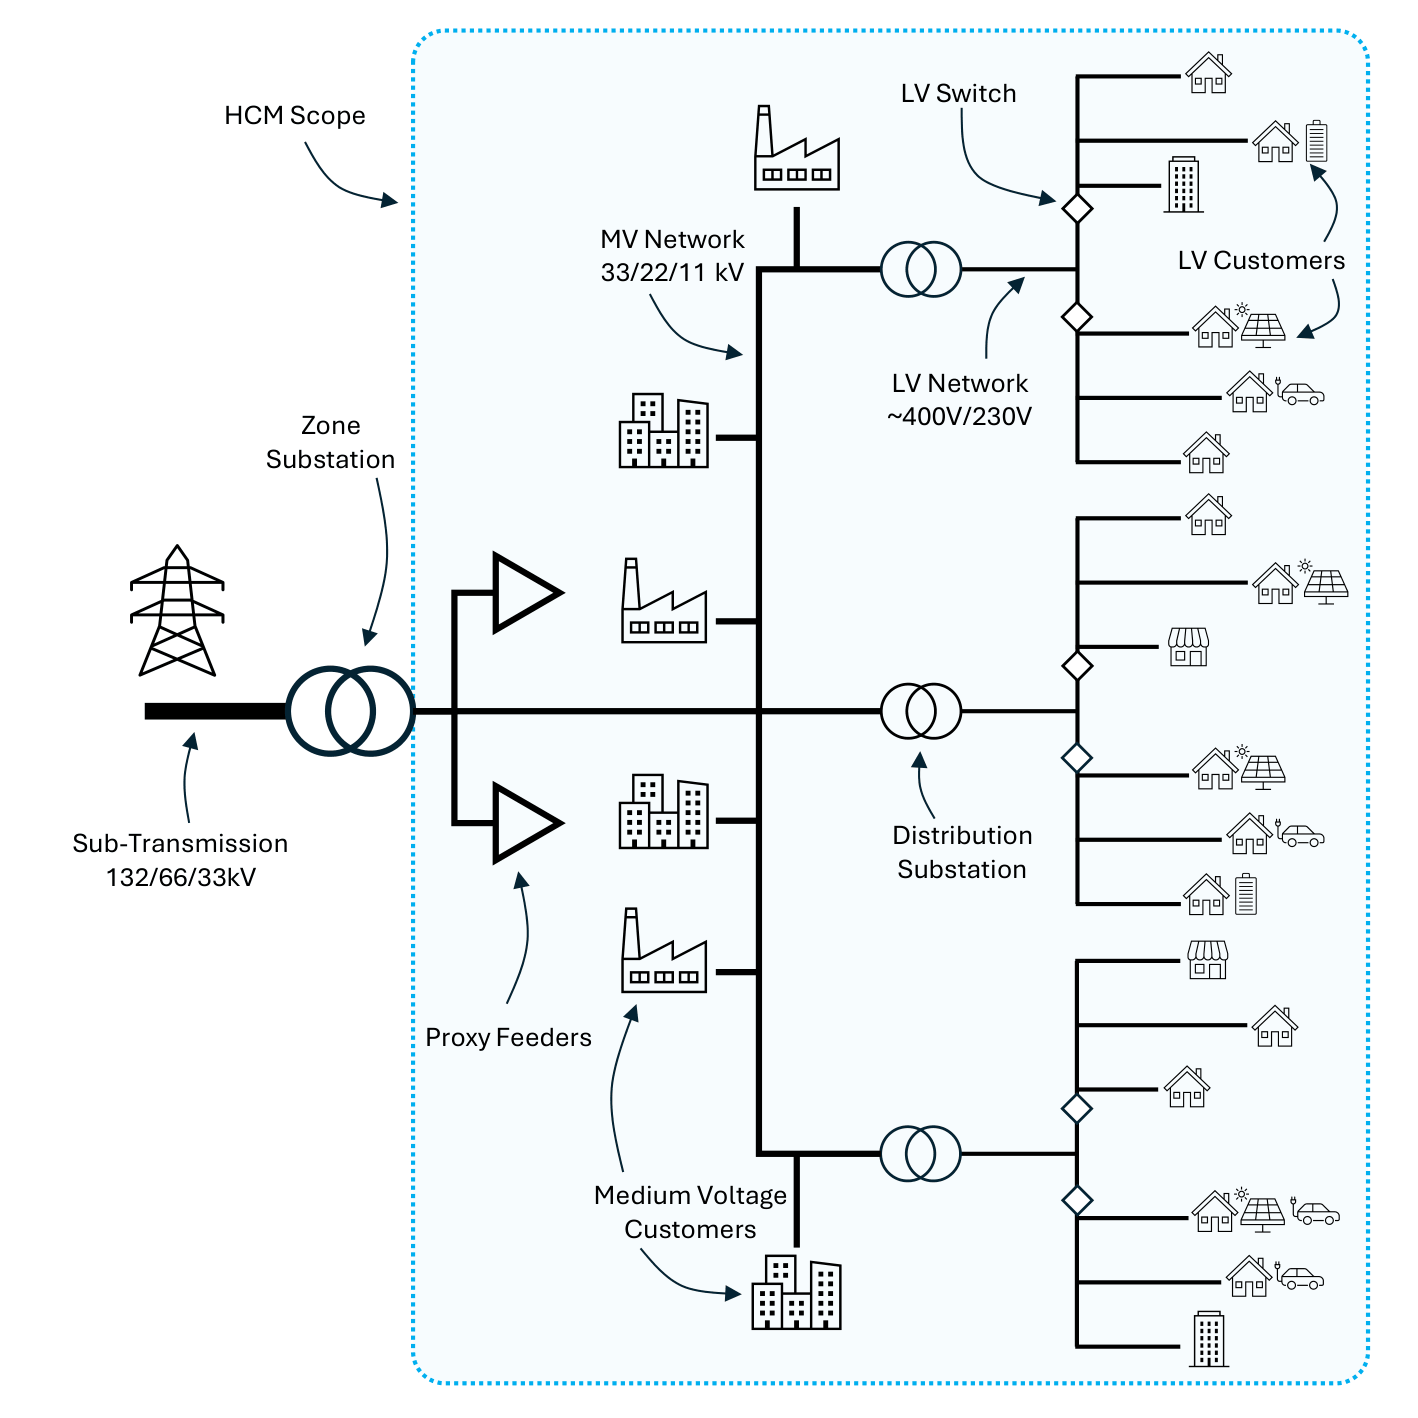
Because the HCM runs one feeder at a time, the net power flows of adjacent feeders are represented as proxy feeders at the zone substation level to ensure power flows remain physically sensible.
Zone Granularity
Measurement zones can be defined at three key locations in the network hierarchy:
- Feeder Head - starts under the feeder head (excluding the adjacent feeder proxies)
- Distribution Transformer - starts under the distribution transformer (also called the distribution substation)
- LV Circuit - starts under the LV circuit head switch, the specific element may be a Breaker, Fuse, Disconnector, Jumper, Load Break Switch, or Recloser.
These can be combined in any configuration.
Each measurement zone runs from its defining asset until it meets the next zone boundary or the end of the network, so zones never overlap regardless of which combination is chosen.
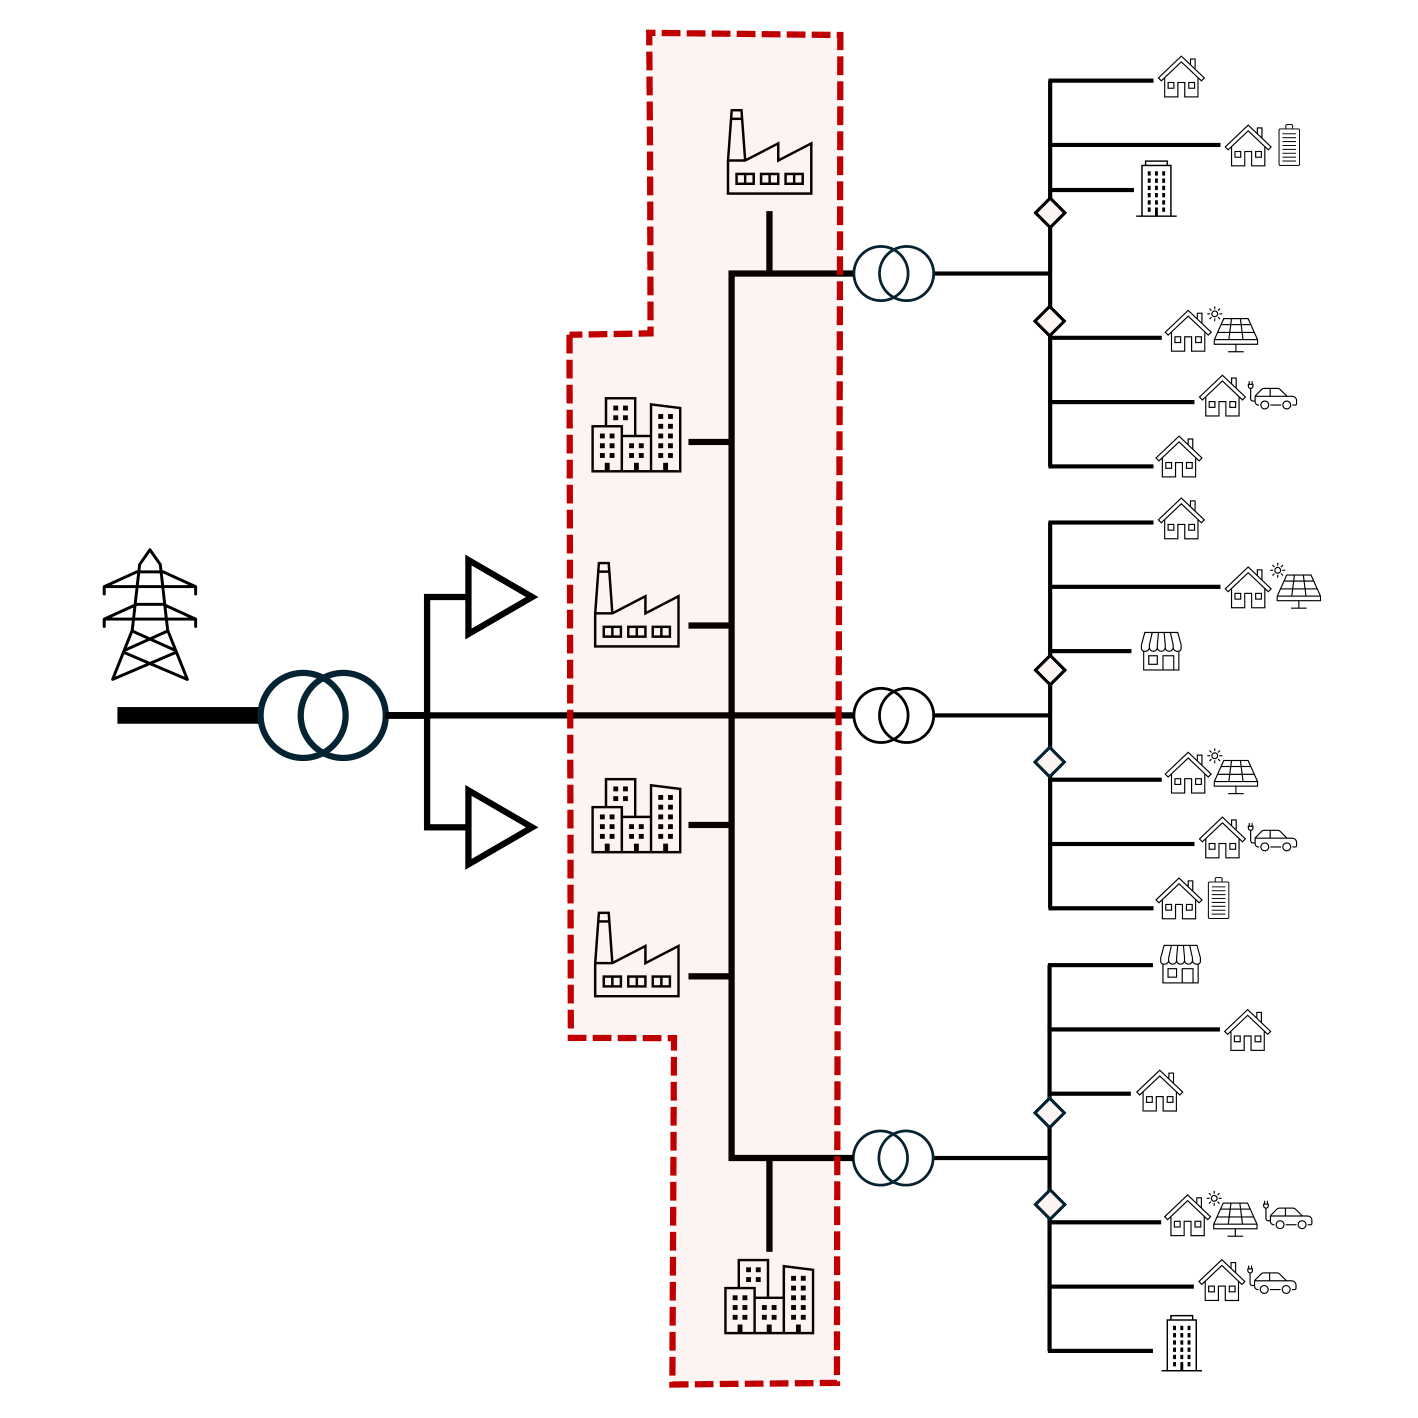
Feeder zones only
One zone per feeder, covering the Medium voltage network from from the feeder head to the end of MV (eg typically to the top of the distribution transformers). For certain studies, this is all that is needed.
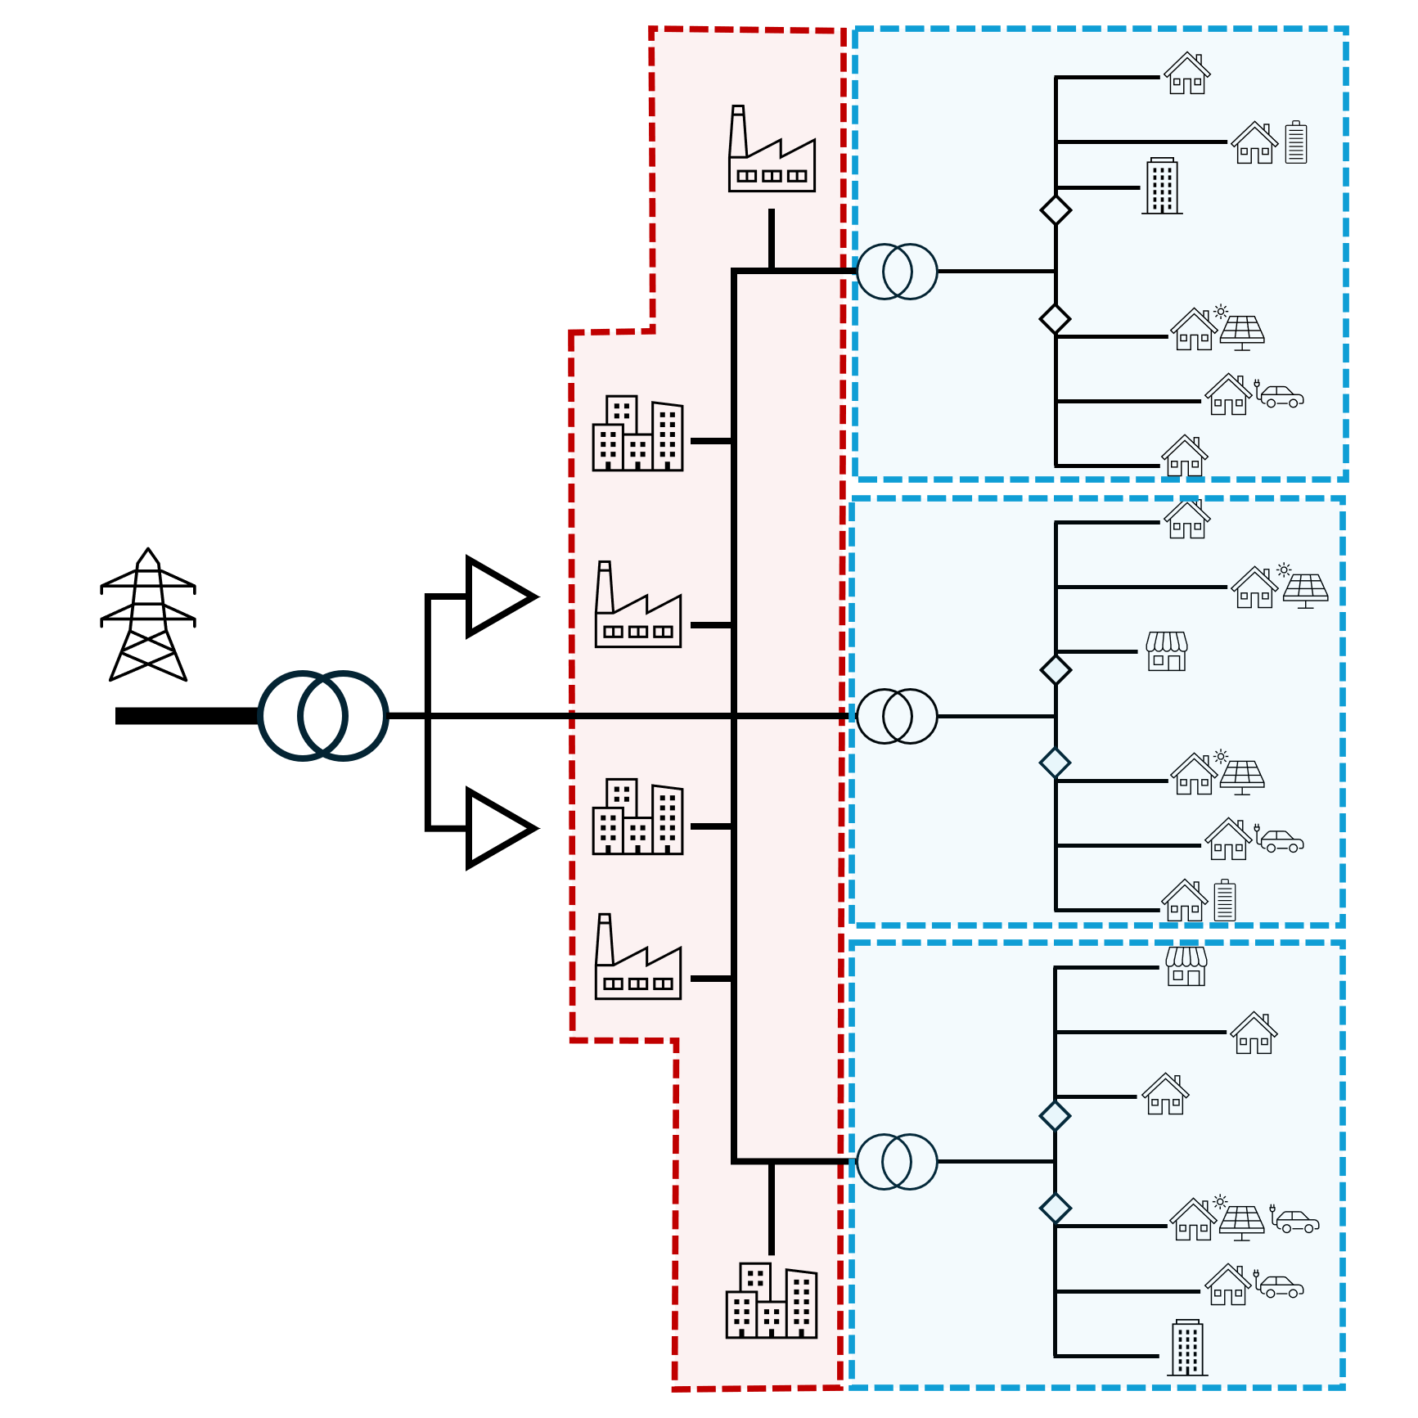
Feeder and transformer zones
One zone at the feeder head (which covers MV), then a separate zone for each distribution transformer and its downstream LV network. This means the feeder head zone covers the MV section, and each transformer zone covers its LV area. Recommended for most standard work packages, and required for Intervention work packages.
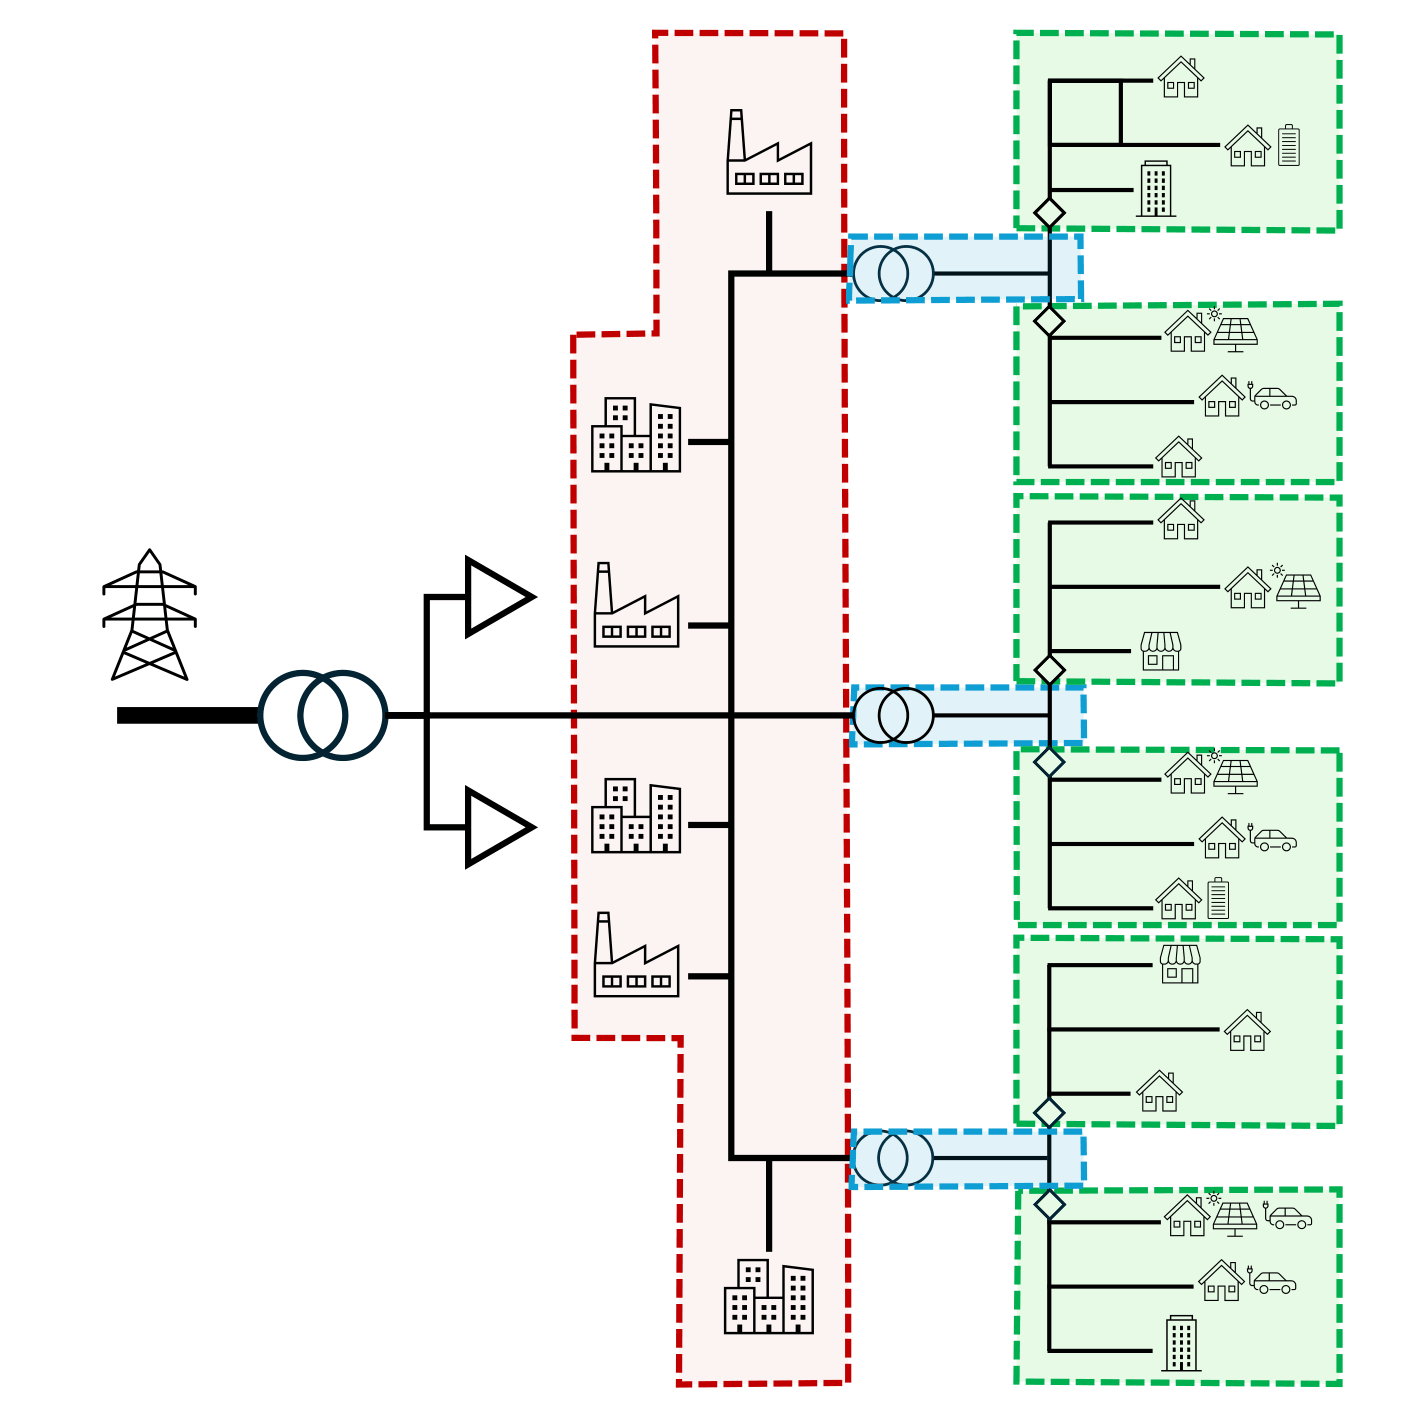
Feeder, transformer, and LV circuit zones
The finest level of granularity. A zone at the feeder head, a zone at each distribution transformer, and a further zone for each individual LV circuit (eg a fuse, switch, etc). This allows metrics to be attributed down to specific LV circuits.
Note that if the LV circuits start immediately downstream of the transformers, the transformer zone will then be empty (no nodes) and will there be no metrics for the the transformer.
Loops and Open Points
Where a loop is detected in the LV network, LV circuit-level zones cannot be defined for that section. Instead, the entire downstream network of the affected distribution transformer is treated as a single transformer-level measurement zone, regardless of the configured zone granularity. The diagram below illustrates how this applies in practice.
Each zone aggregates the network between its defining asset and the next zone, linking results directly to the asset ID that defines the zone's start. Because zones never overlap, risk metrics such as the Customer Energy Curtailment Value (CECV) or Values of Customer Reliability (VCR) can be accurately aggregated without double-counting.
-
They never overlap - Each zone runs from its defining asset to the next zone boundary or line end, ensuring no double-counting.
-
Load and generation metrics are local only - Metrics like
gen_overvoltage_kwhorload_max_kw(from the Network Performance Metrics Enhanced) are calculated based solely on loads and generators connected within that specific measurement zone. These values do not aggregate energy flows from downstream zones. -
Network flow metrics aggregate through the zone - Metrics that do not specifically measure load or generation (such as
peak_importorpeak_export, from the Network Performance Metrics Enhanced) are based on net flows into and through the measurement zone. -
Voltage metrics use a single voltage base per zone - Each zone evaluates voltage metrics at one base: the LV base for transformer zones and LV circuit zones, and the MV (highest) base for feeder-head zones. Nodes at other bases are excluded from voltage metrics.
Please refer to the Description column of the Output tables for more details on how each metric is calculated.