Hosting Capacity Analysis - How it Works
Overview
The hosting capacity analysis uses time series power flows of a continuous model of the electricity distribution network, from the busbar of major substations at the Medium Voltage level (22 kV or 11 kV for example) to energy consumers connected to the Low Voltage (415 V or 230 V) network, with one load flow calculation performed for each 30 minute interval in each day, over a multi-year forward planning horizon.
The load and generation inputs vary with each 30 minute time slice, based on forecasts of end consumer and device behaviour over time. Typically, multiple scenarios are developed and executed to provide result sets ranging from best to worst case outcomes, and to explore different constraint remediation opportunities.
End users of the HCM create and apply the inputs for each scenario by setting up work packages, which also define which portions of the network the scenario is to be applied to, and submit them to the HCM for processing.
For each 30 minute time slice modelled in each power flow calculation, the HCM software checks the power flowing through each branch and the voltage at each node in the electrical model and records any instances where the thermal rating of an asset would be exceeded, or the voltage at a node would be outside of the allowable voltage range.
This data is written out to a database to allow analysis of the results, and subsequently the development and planning of remediation outcomes.
A high level conceptual overview of the HCM is provided in the diagram below:
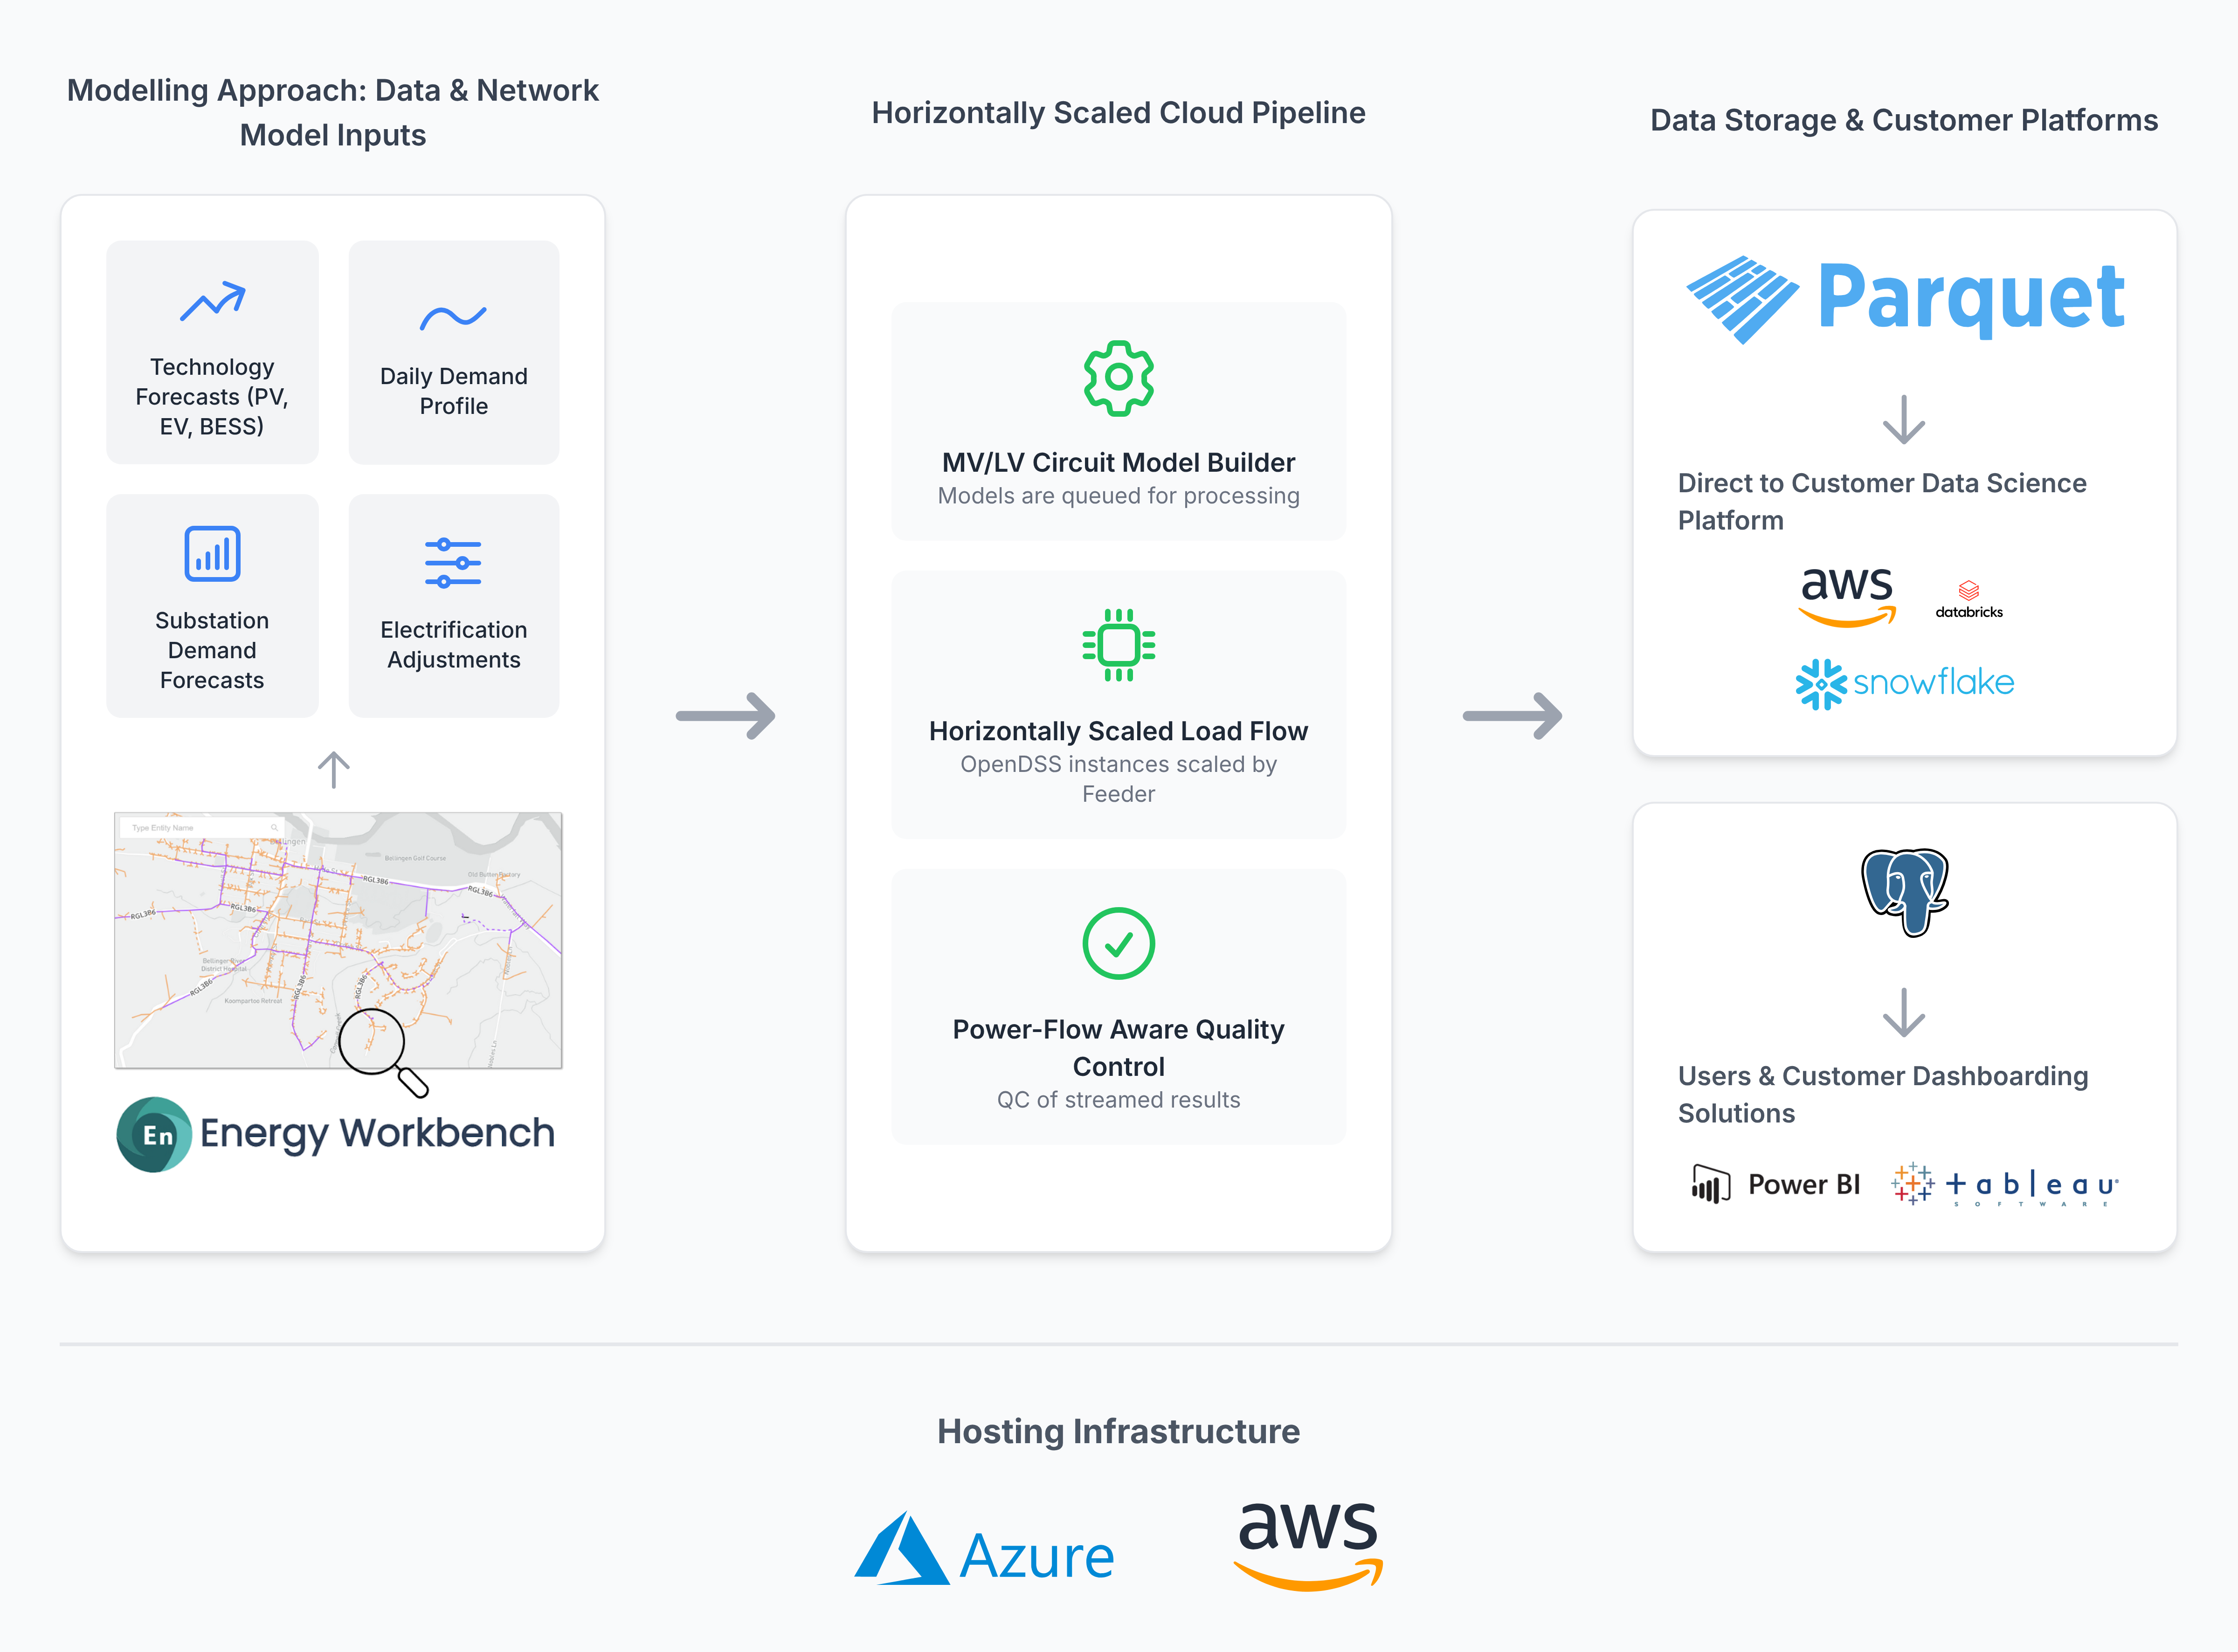
Overview of Power System Model
The power flow calculation engine used is OpenDSS, an open source electrical simulation tool developed by EPRI and designed for electricity distribution network modelling.
The electrical network model is typically obtained from the Geographic Information System (GIS), and ingested and transformed into the IEC CIM data model in the Energy Workbench platform. For those readers interested in details about the network model held in the Energy Workbench, a full description can be found in our CIM model profile. One of the HCM sub-systems converts the network model held in Energy Workbench into the format required by OpenDSS.
The HCM uses the unbalanced modelling capability of OpenDSS, meaning that both the load and generation on each phase, and the actual phase configuration of the network is modelled. This includes correct modelling of Single Wire Earth Return SWER networks.
OpenDSS has a number of features designed to maximise convergence of each power flow solution with highly loaded unbalanced three phase networks - a necessary feature when performing hosting capacity studies to ensure model results are obtained even with significant voltage excursions at the edge of the network due to increasing load and generation in forecast scenarios.
Looking "top down": The operation of voltage regulation equipment for the main power transformer between the HV and MV bus is modelled, using either a Closed Loop Voltage Control (CLVC) algorithm based on downstream MV node voltages, or Line Drop Compensation (LDC) to maintain the bus volts to a defined setpoint.
Looking "bottom up": Load and generation inputs into the power flow models for household and small commercial level consumers are applied to LV network supply points in the model, with larger commercial and industrial load and generation attached directly to the MV network. This provides a complete electrical model of the distribution network, with load and generation, for each 30 minute power flow.
For other network elements in the model between the "top" and "bottom":
- Line impedance is calculated using conductor length and sequence impedances - both real and reactive components.
- Distribution transformer tap positions are used by the model, and typically calculated as part of the model calibration procedures
- Voltage regulators connected in line on MV feeders are modelled according to various control schemes, which are provided as inputs
- Capacitor banks are modelled
- Distribution transformer impedance and vector groups are considered in the models.
- SWER line isolation transformers are modelled
From load and generation forecast to power system impacts
The compilation of hosting capacity results starts with the compilation of a "base year" of 30 minute load flow studies, using historical AMI load and generation data for each 30 minute time interval. Where AMI data is not available, various methods can be employed to synthesise load and generation patterns to provide the required inputs.
The base year provides a view of where current network constraints exist over the whole network, creates a result set for validating the accuracy of the model, provides metrics on the reliability of power flow model convergence for each feeder, and provides the base load and generation inputs for future hosting capacity analysis.
Along with the physical network model and historical load and generation inputs, the other key input into the hosting capacity analysis is forecasts of future energy consumption and generation patterns. These are supplied as various data tables by users of the application.
With a 10-year forward planning model for a distribution network with 500 medium voltage feeders, there are around 90 million individual load flow studies to compile the complete result set for one scenario. This presents many challenges for reliable model convergence, efficient use of computational resources, timely model completion and results compilation - these topics and how the HCM tackles these challenges is explored further in this overview.
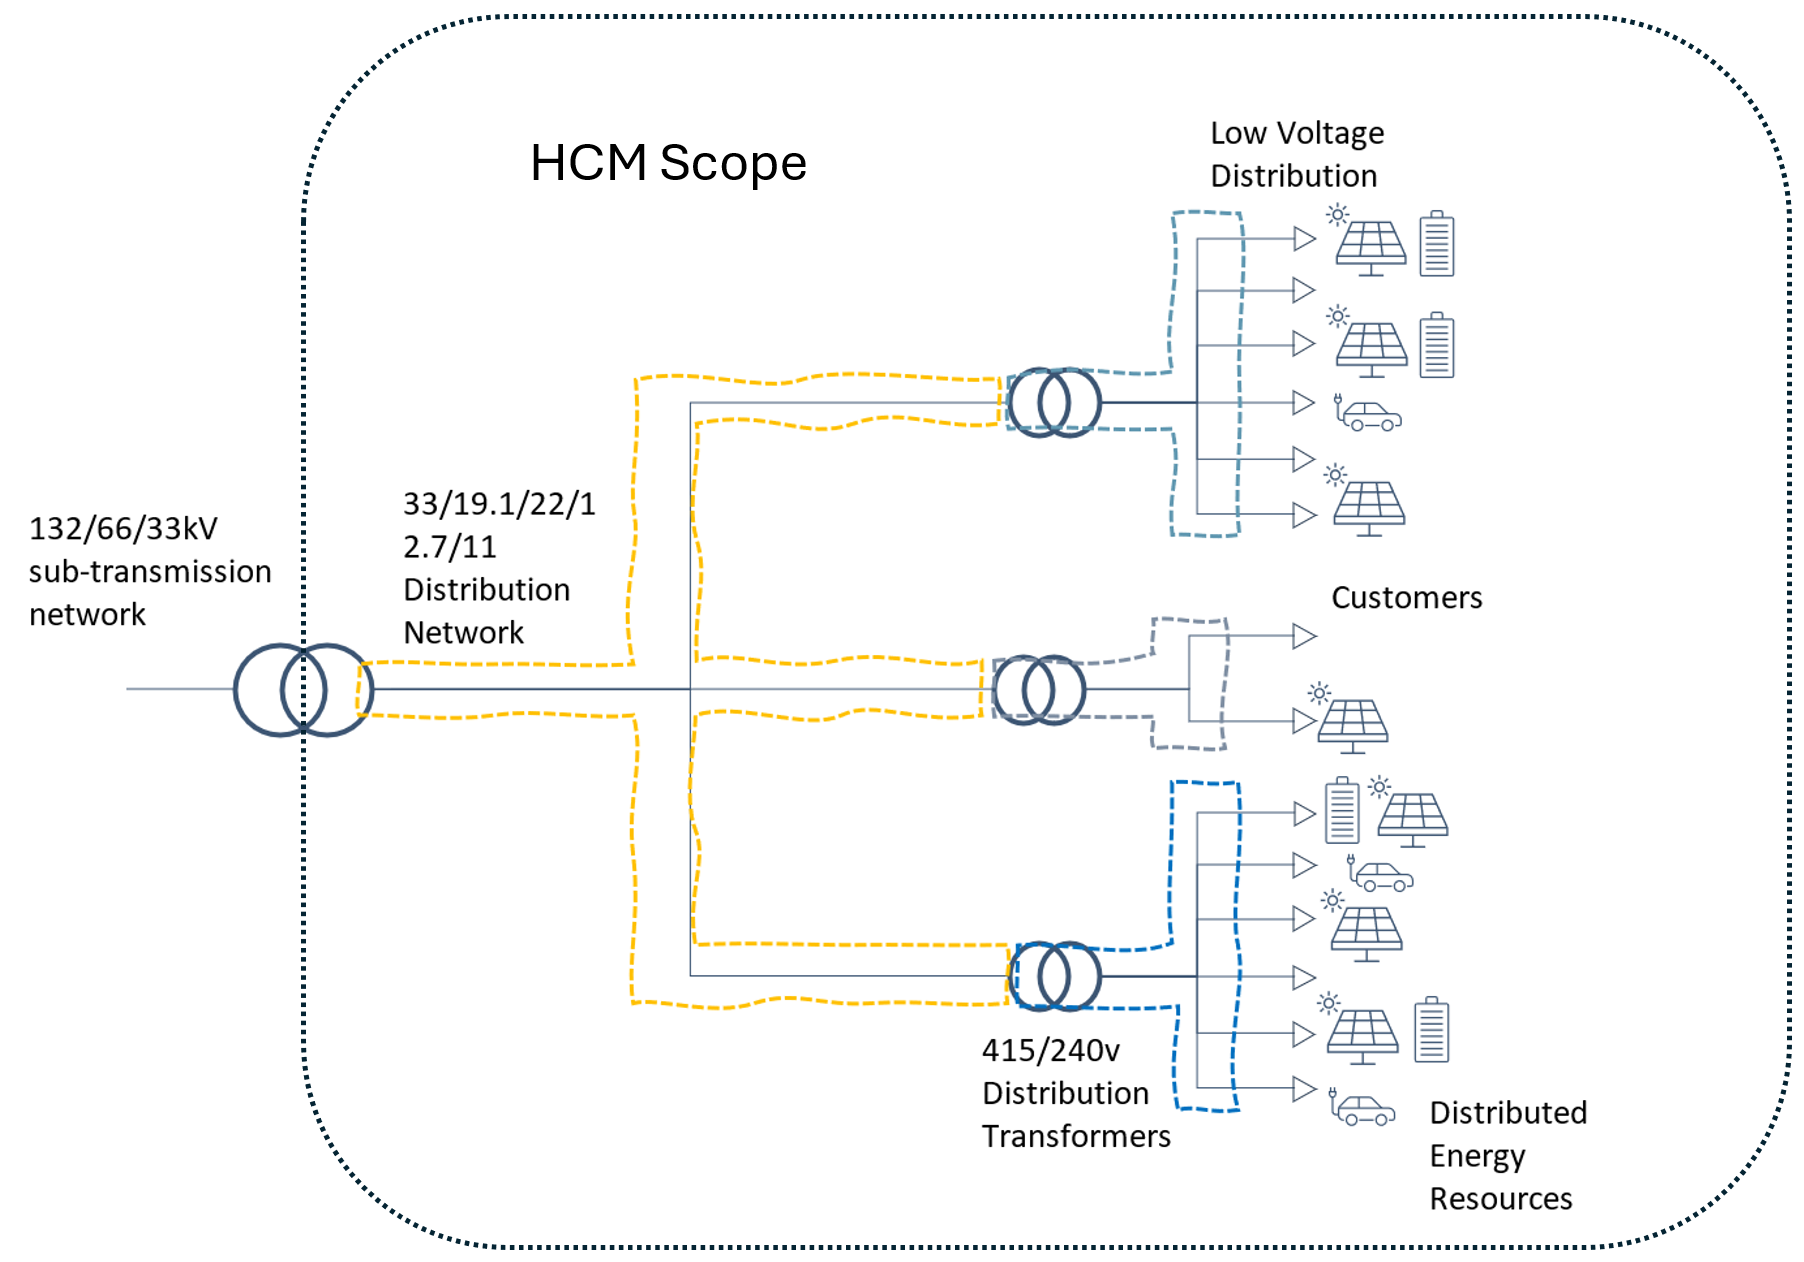
The scope of HCM studies is illustrated in the diagram below. The network within the dotted line is included, as is the power transformer at zone substation sites. Note that the sub-transmission and transmission networks are not considered by the HCM.
There is also an option to record the voltage and current at each node and branch in the network for each 30 minute interval in the study. This mirrors the data provided by Advanced Metering Infrastructure (AMI), but for future load and generation behaviour in the model.