Layers panel
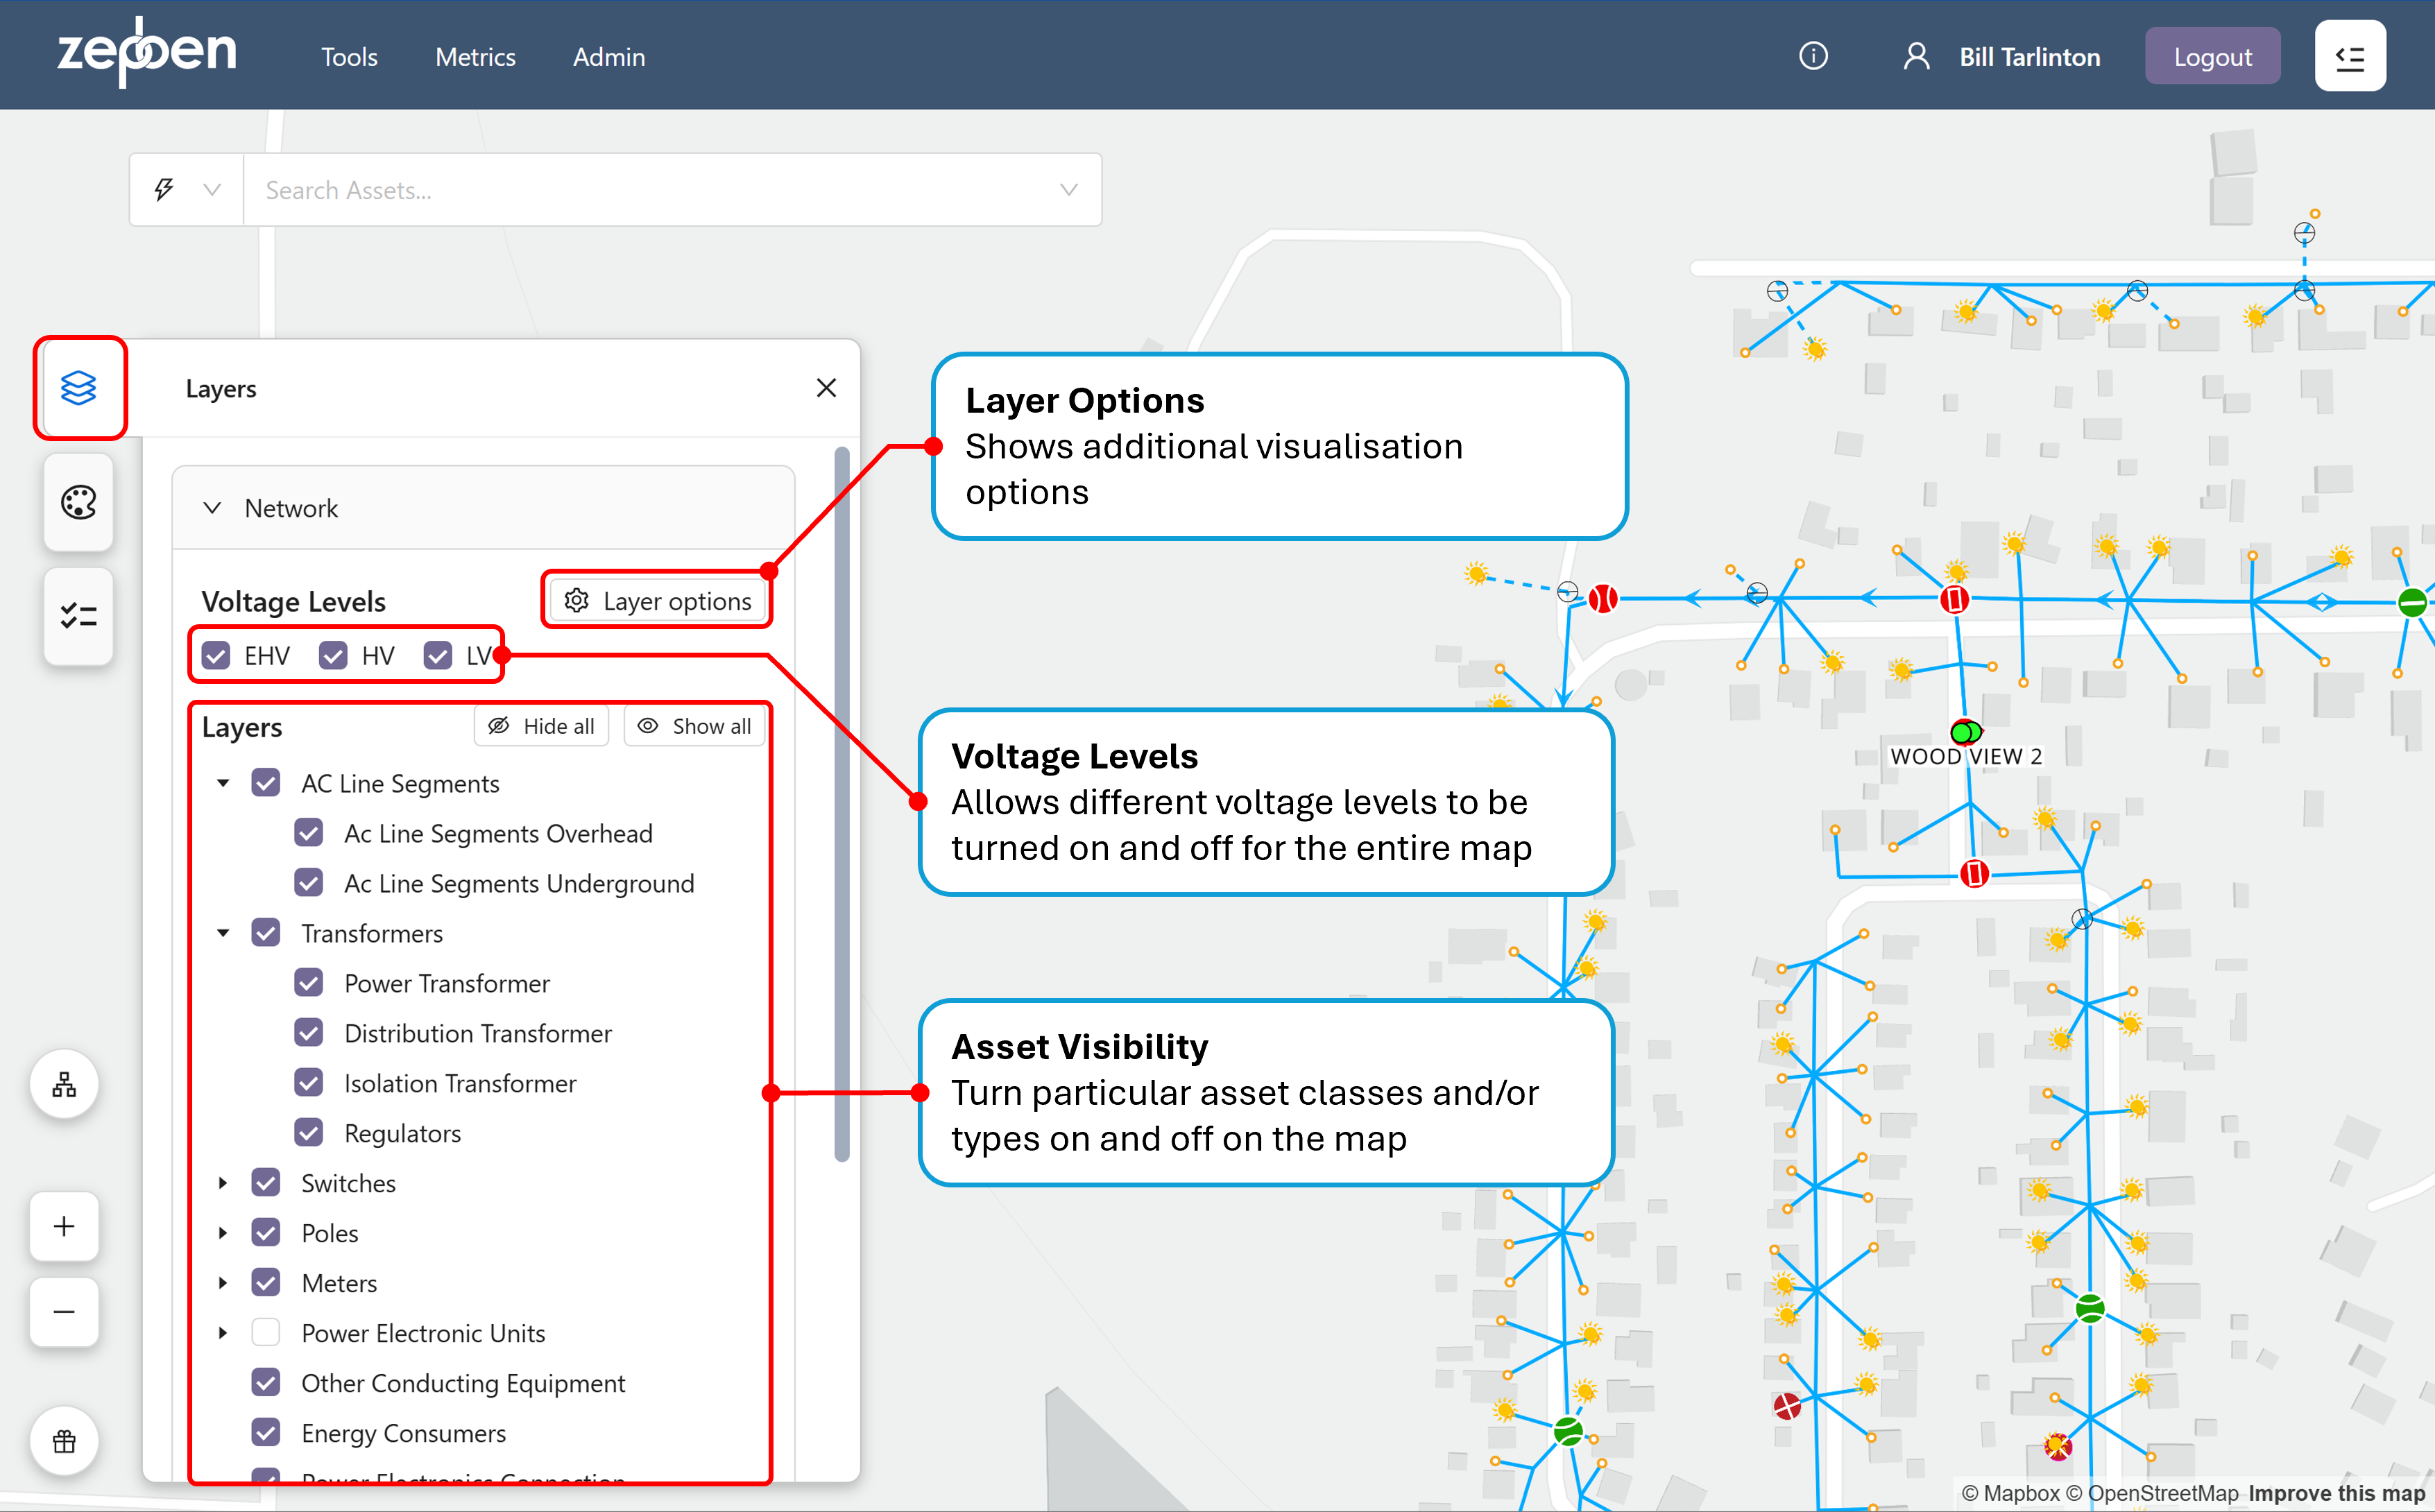
The Layers panel, shown below, is a pop up window that provides various controls over how the network assets are rendered. It includes functions to:
- Turn entire asset classes on or off on the map,
- Turn entire voltage levels on or off on the map,
- Enable or disable arrows on conductors representing the path away from a primary supply point,
- Colour the conductors by different phase, feeder, impedance or voltage,
- Display a particular feeder,
- Show or hide proposed and out of service assets
- Show or hide assets that are de-energised or have not been assigned a voltage level.
Many of the options selected in the layers panel will be remembered by Network Explorer, meaning that next time you open the application, the same layer options will be restored.
Some basic concepts
Before describing the Layers panel, its important to understand how the network is divided up or grouped in the Energy Workbench and Network explorer. This is done in several ways:
-
By voltage level – All network assets are placed in one of three voltage levels.
- EHV (Extra High Voltage) – typically greater than 66kV
- HV (High and Medium Voltage) – typically between 66kV and 6.6kV, and
- LV (Low Voltage) – either 120V or 240V, depending on the country. For example, in Australia, this will be 240 V. In the USA, this will be 120V
-
By equipment container – there are four of these:
- Zone Substation – all assets within the boundary of a major substation.
- HV Feeder – all assets on a radial HV feeder
- LV Circuit – all assets fed from the LV busbar of a distribution transformer.
- EHV Circuit – all assets on a circuit between two Zone Substations at the EHV voltage level.
-
By asset class – these follow the IEC CIM model. More information about the IEC CIM model and which parts have been implemented in the Energy Workbench can be found at this link
Layer Panel Controls
Voltage Levels
These check boxes allow all assets within a particular voltage level to be turned on or off. Doing this removes the assets at the voltage level from the maps, but any assets in that voltage level will still be searchable in the asset search bar.
The three voltage levels are as described above.
Asset visibility control (Layers)
There is a hierarchy used to select which assets to display that is aligned with the IEC CIM object hierarchy, with additional classification of transformer types based on their functions.
For instance, switch types of Recloser, Breaker, Disconnector and Fuse can be separately turned on or off, which corresponds to the equivalent CIM object model for switches.
There is only one class in the IEC CIM model for transformers and so these are categorised by their function, that is: Power Transformer, Distribution Transformer, Isolation Transformer and Regulator.
it is possible to have different symbol graphics for the same type of asset – for instance a disconnector in the LV network could have a different symbol to a disconnector in the HV network.
Layer options
The Layer options button displays an additional dialog box, as illustrated below.
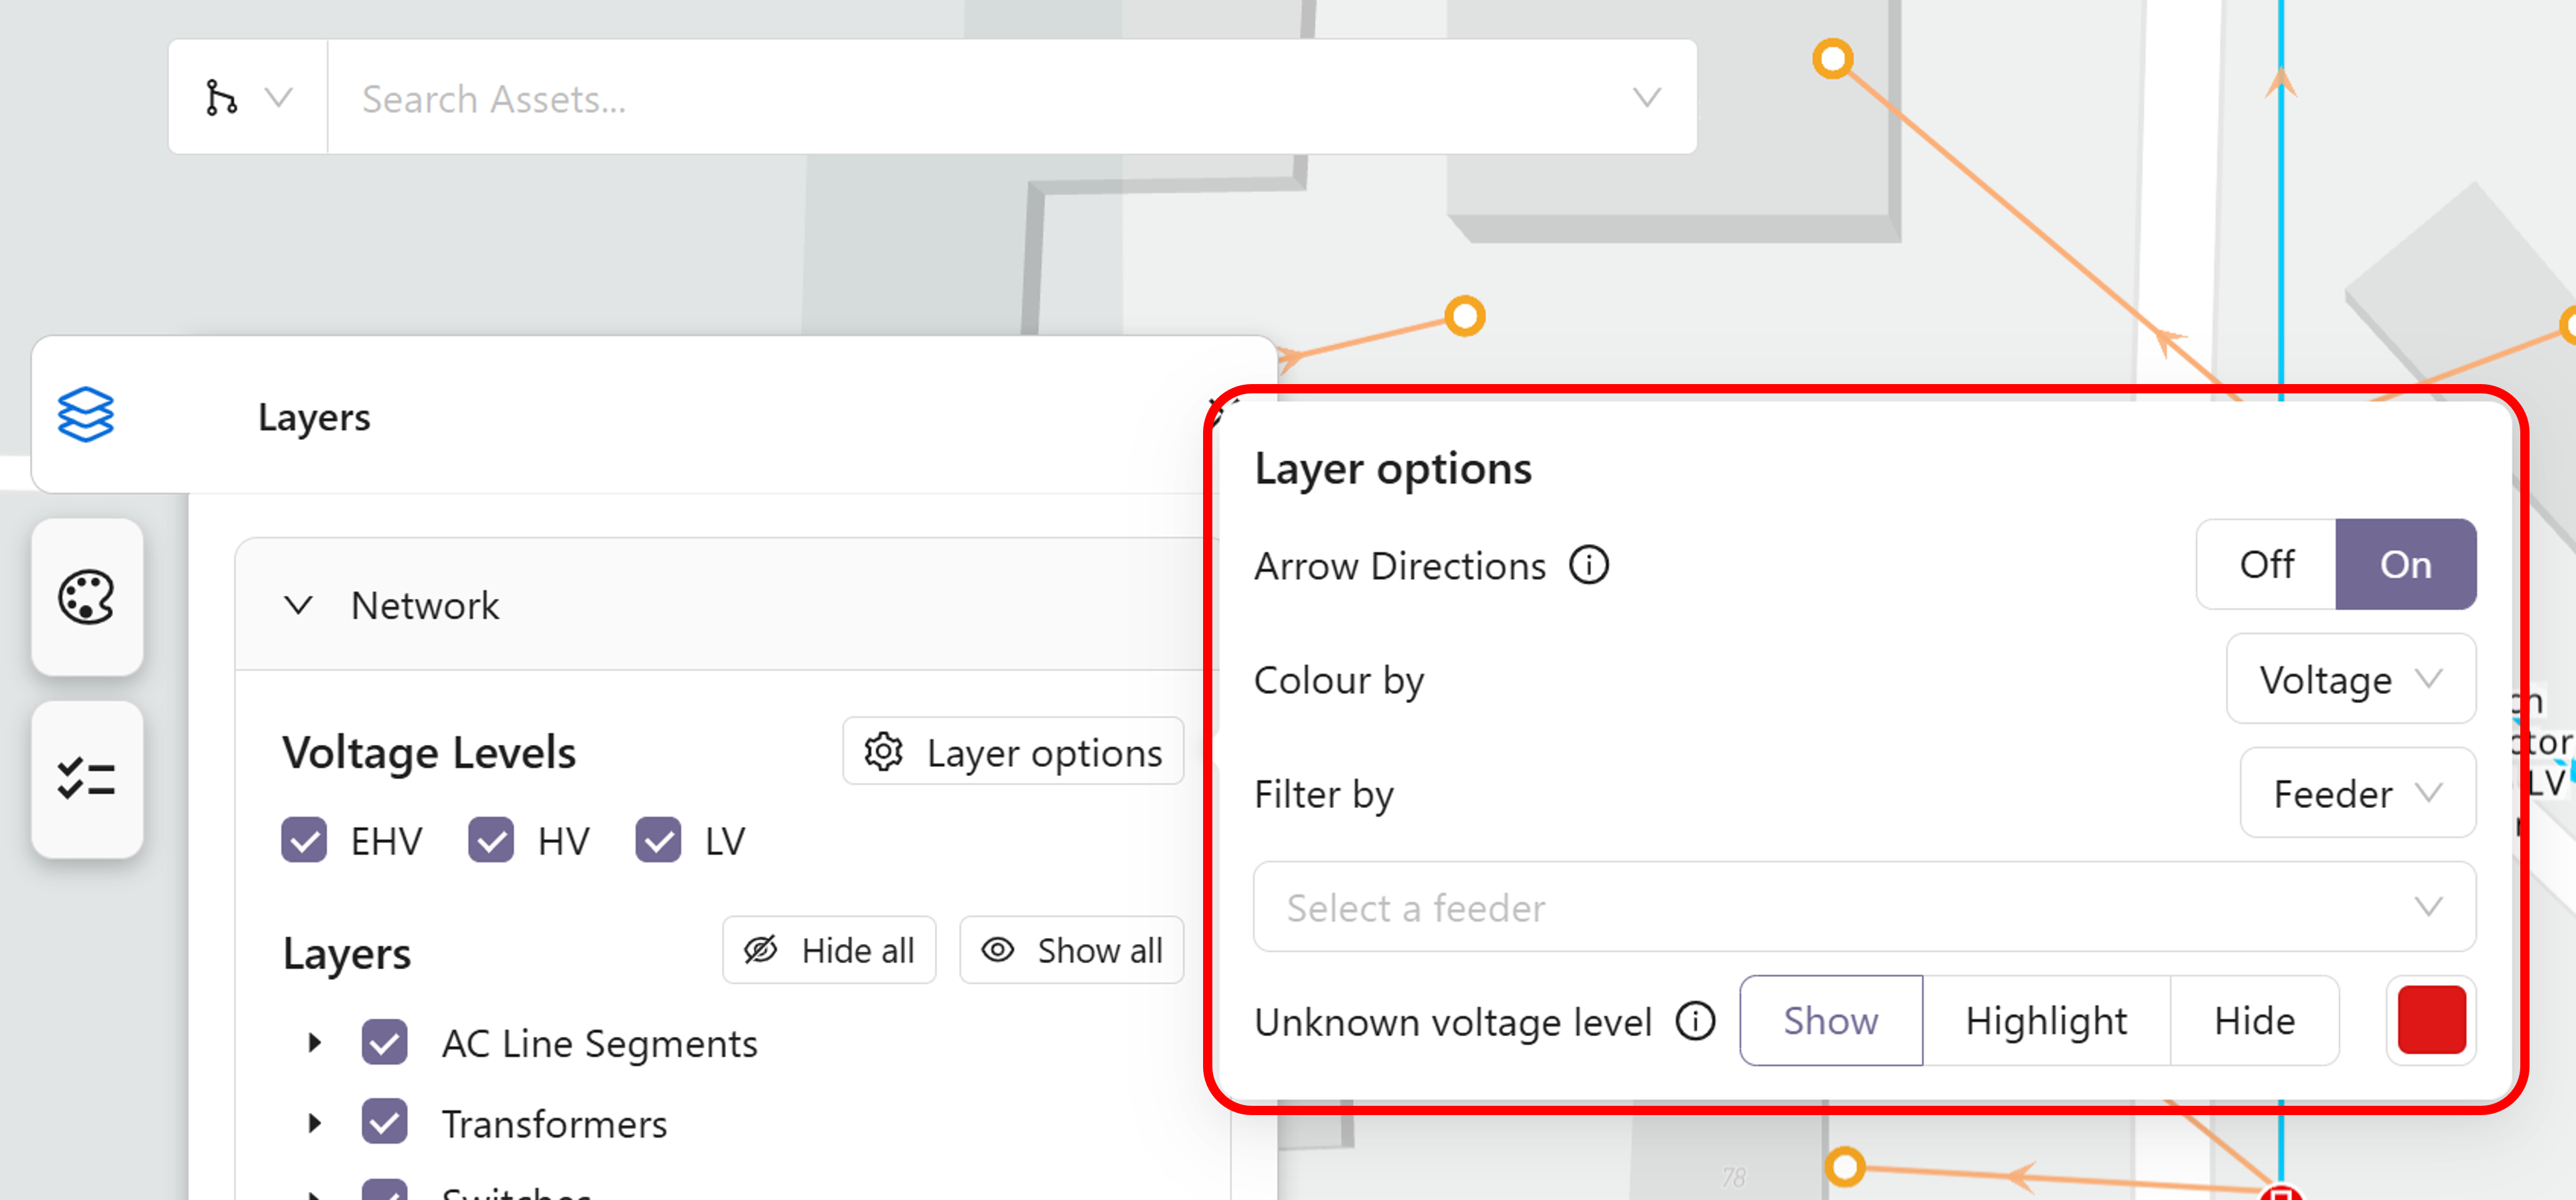
Arrow Directions:
Turning this on will display arrows on radial conductors (AC Line Segments) that point away from (downstream of) the primary supply source for the conductor. In the case of a HV conductor, the primary supply will often be from the Circuit Breaker in the Zone Substation at the start of the feeder containing the conductor. Where there are loops along the network, double arrows will be used on the conductors that form part of the loop. An example of how the arrows should appear on the maps is provided below.
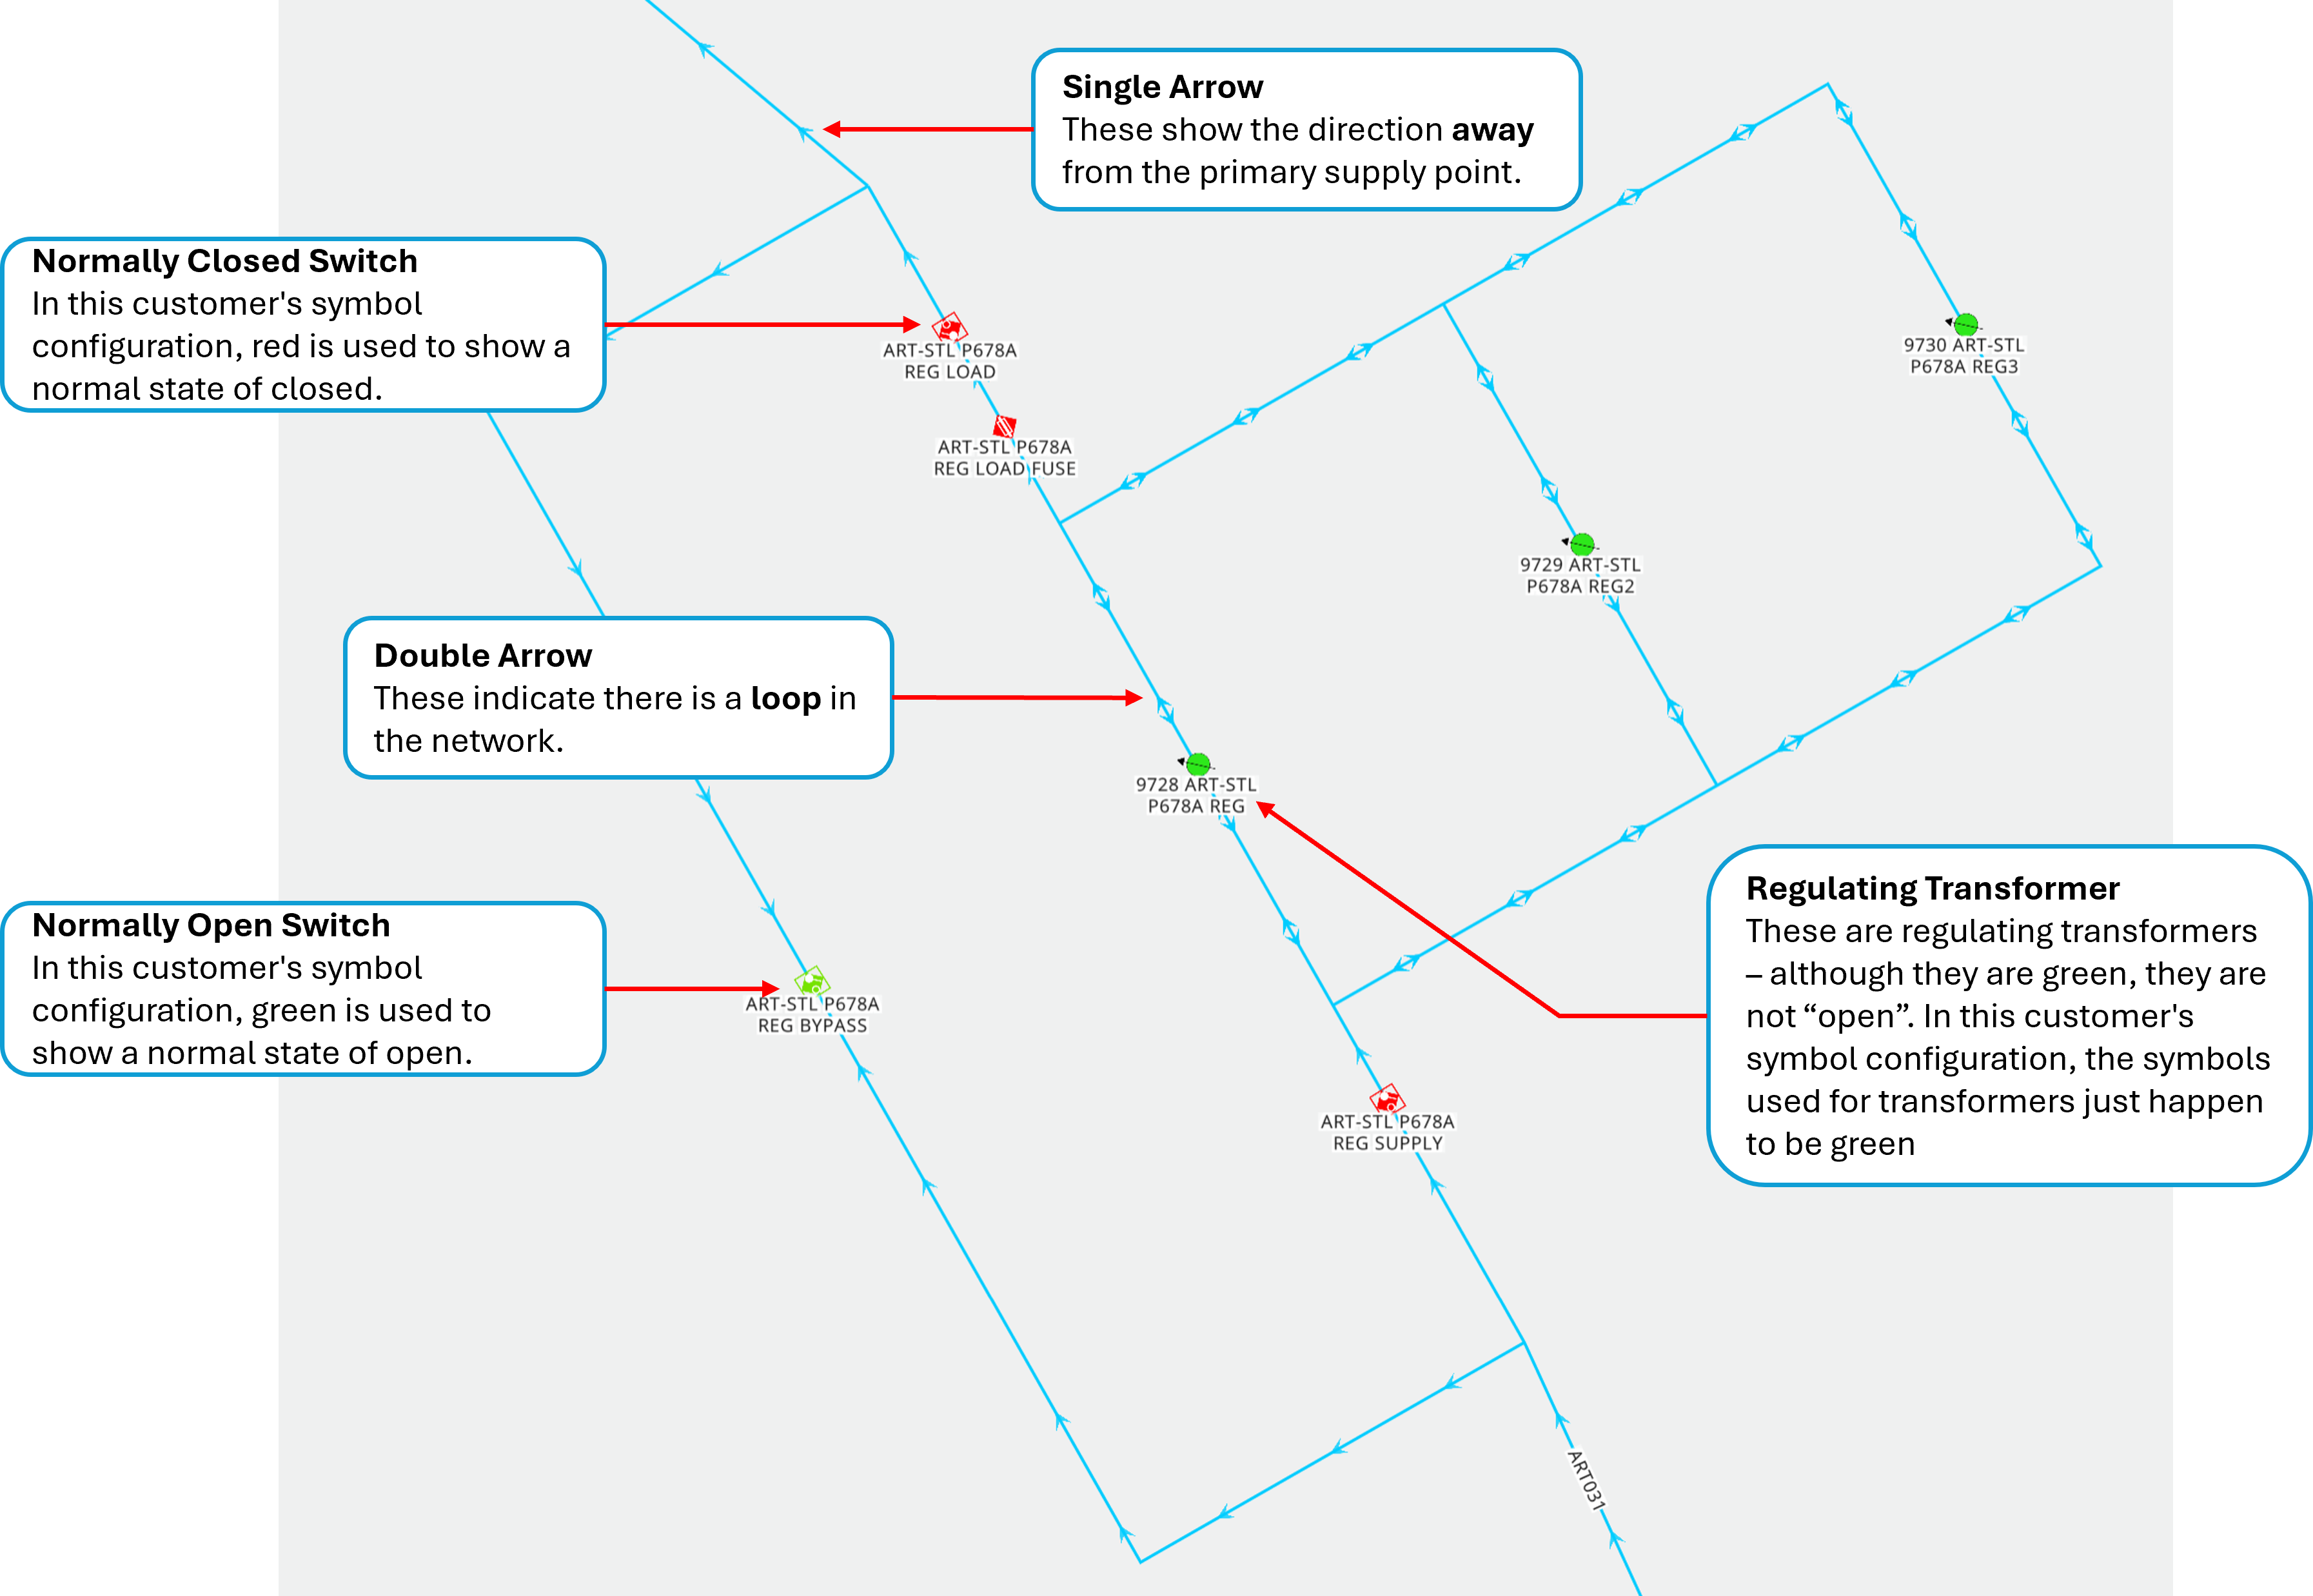
The arrows do not represent the actual flow of power, as there can be large amounts of embedded generation in the network (for example from roof top PV) that results in reverse power flows at certain times. The arrows show the direction away from the primary source of power in the network.
The arrows will not be visible for areas of the network that are meshed (not radially fed). This is typically the case for the sub-transmission (EHV voltage levels) and Zone Substation internal bus work, where there is more than one source of supply, and so the “downstream direction” concept does not work.
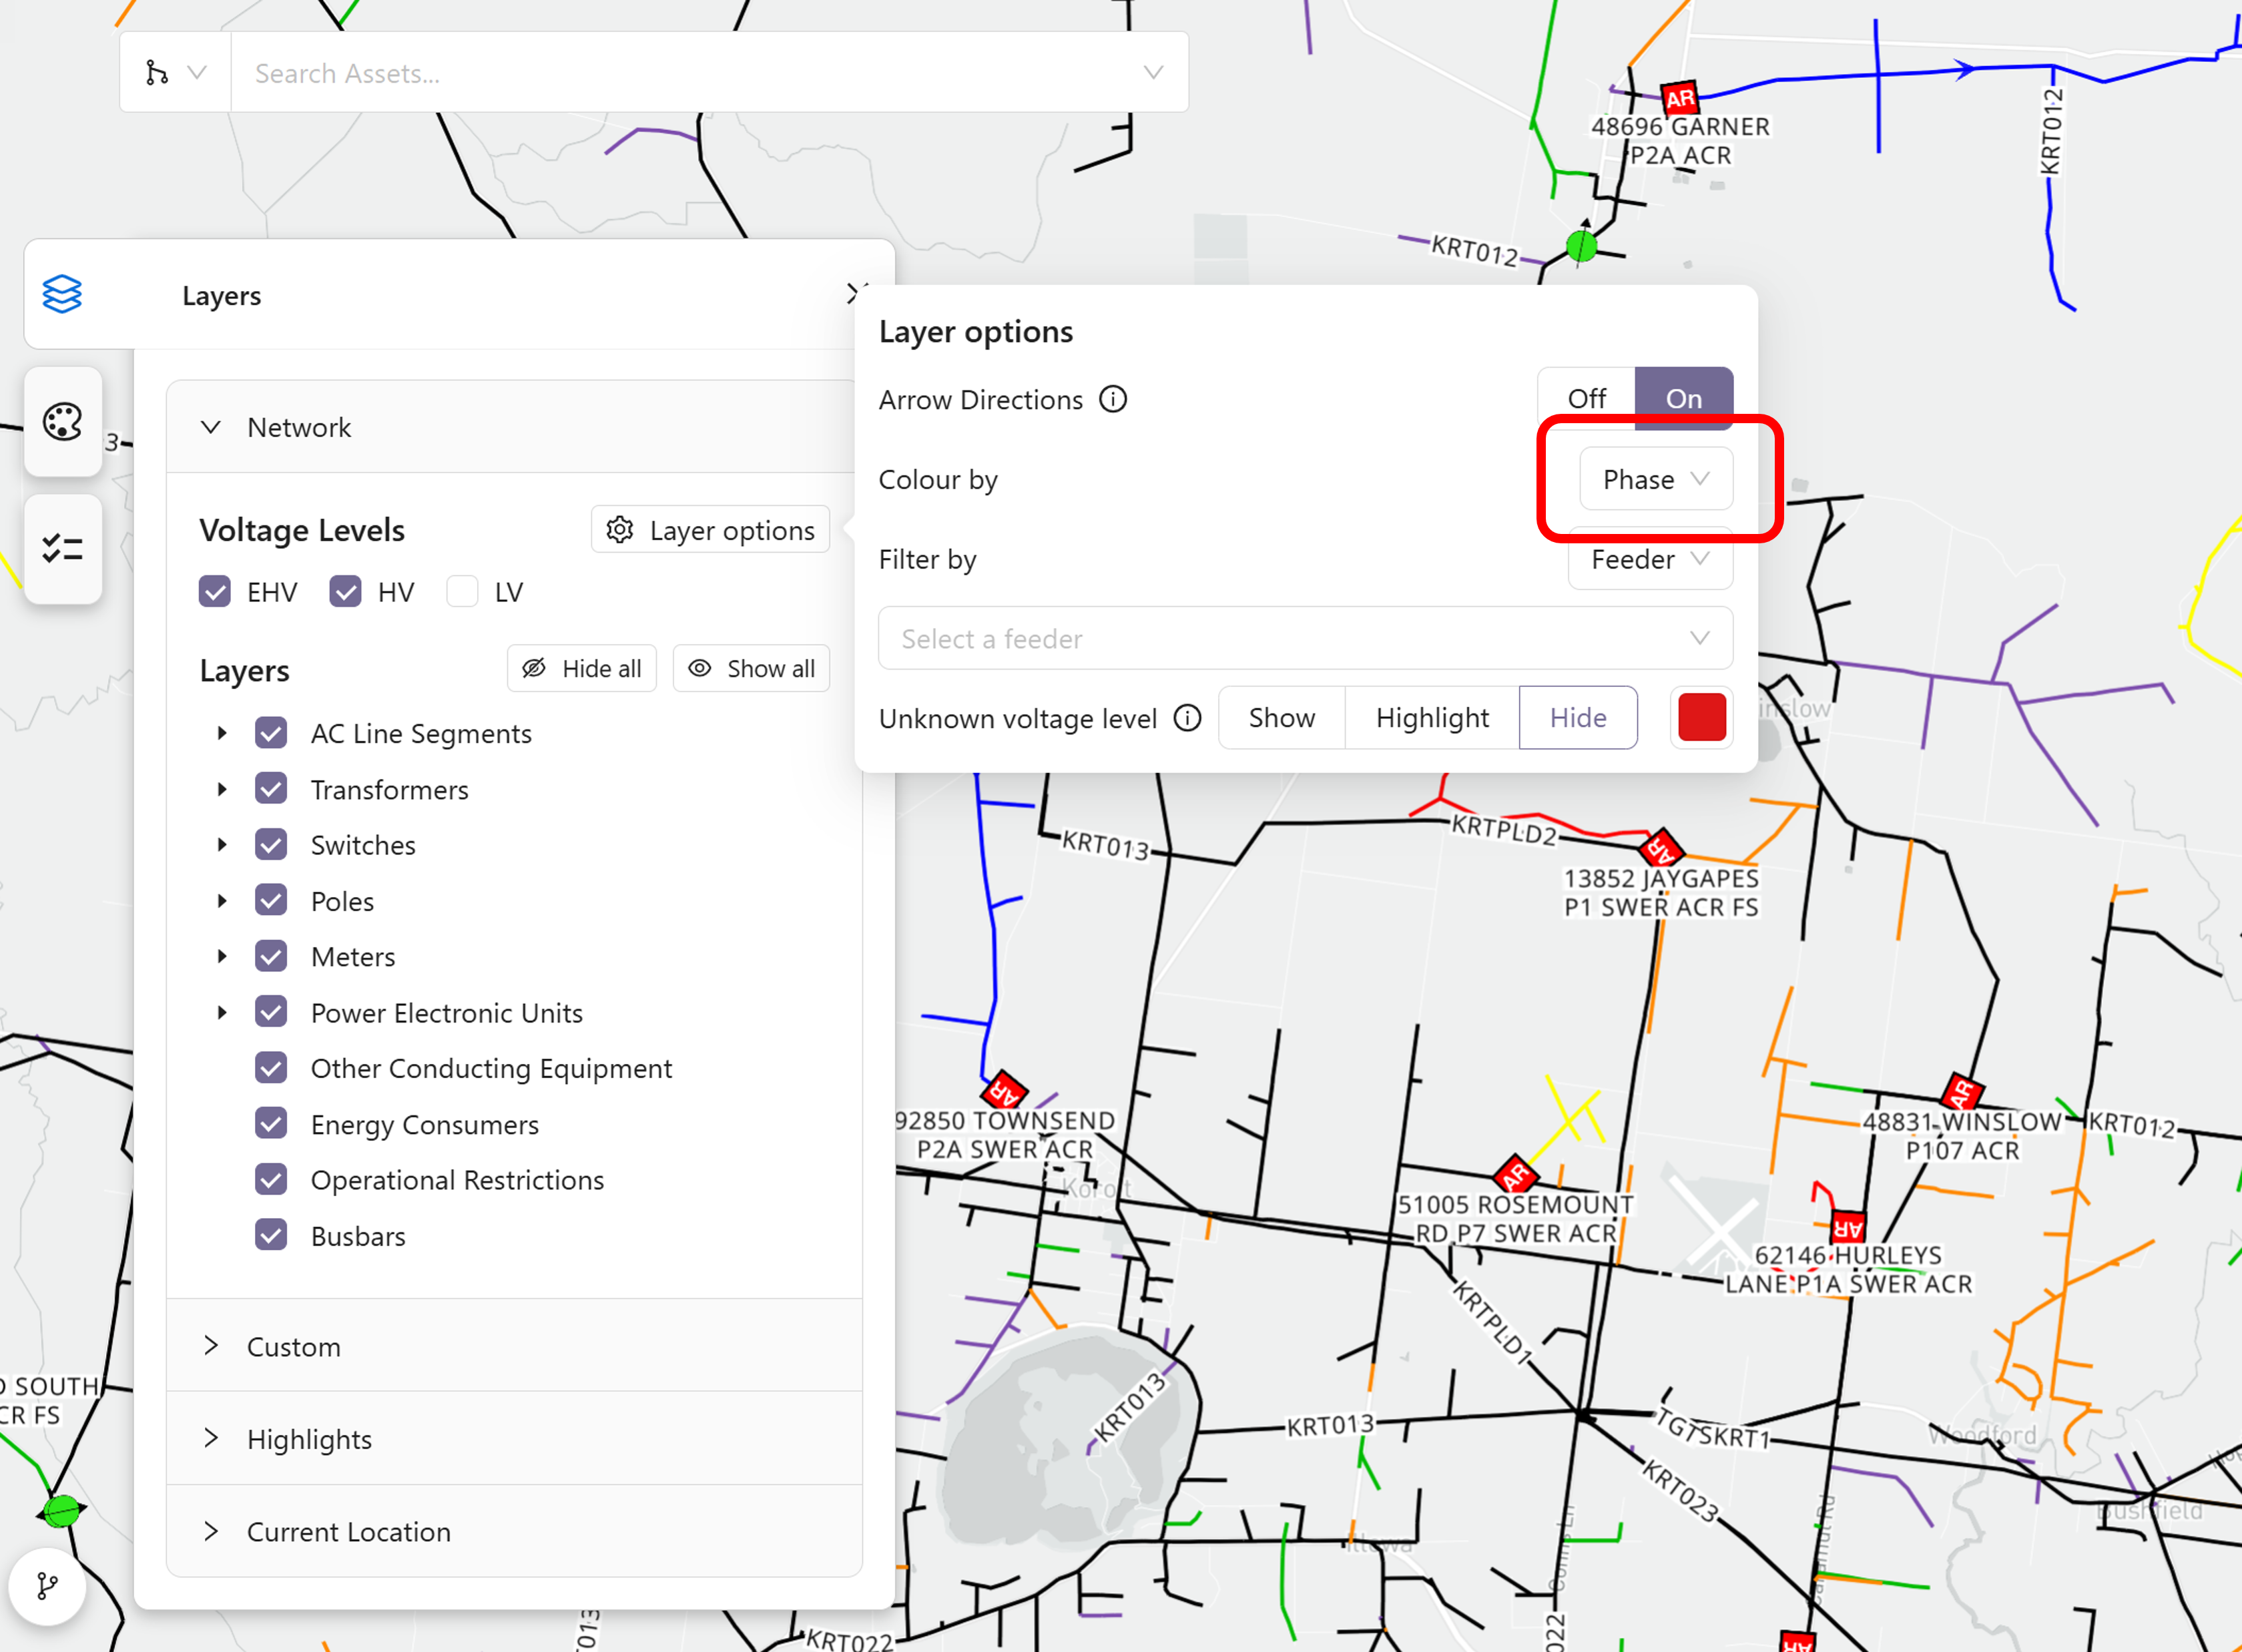
Colour by
The “Colour By” drop down allows all conductors to be coloured by either:
-
Phase: This colours conductors by the phases present in the conductor. A different colour can be used for all phase combinations, for instance ABC, AB, AC, ABCN etc can all have different phase colours, and this is configurable by the system administrator. In the screenshot below, the black lines represent HV conductors with three phases, that form the main “backbone” of the network. The spurs coming off this backbone are often conductors with only two phases present, and each of these has a different colour depending on the phases that are present.
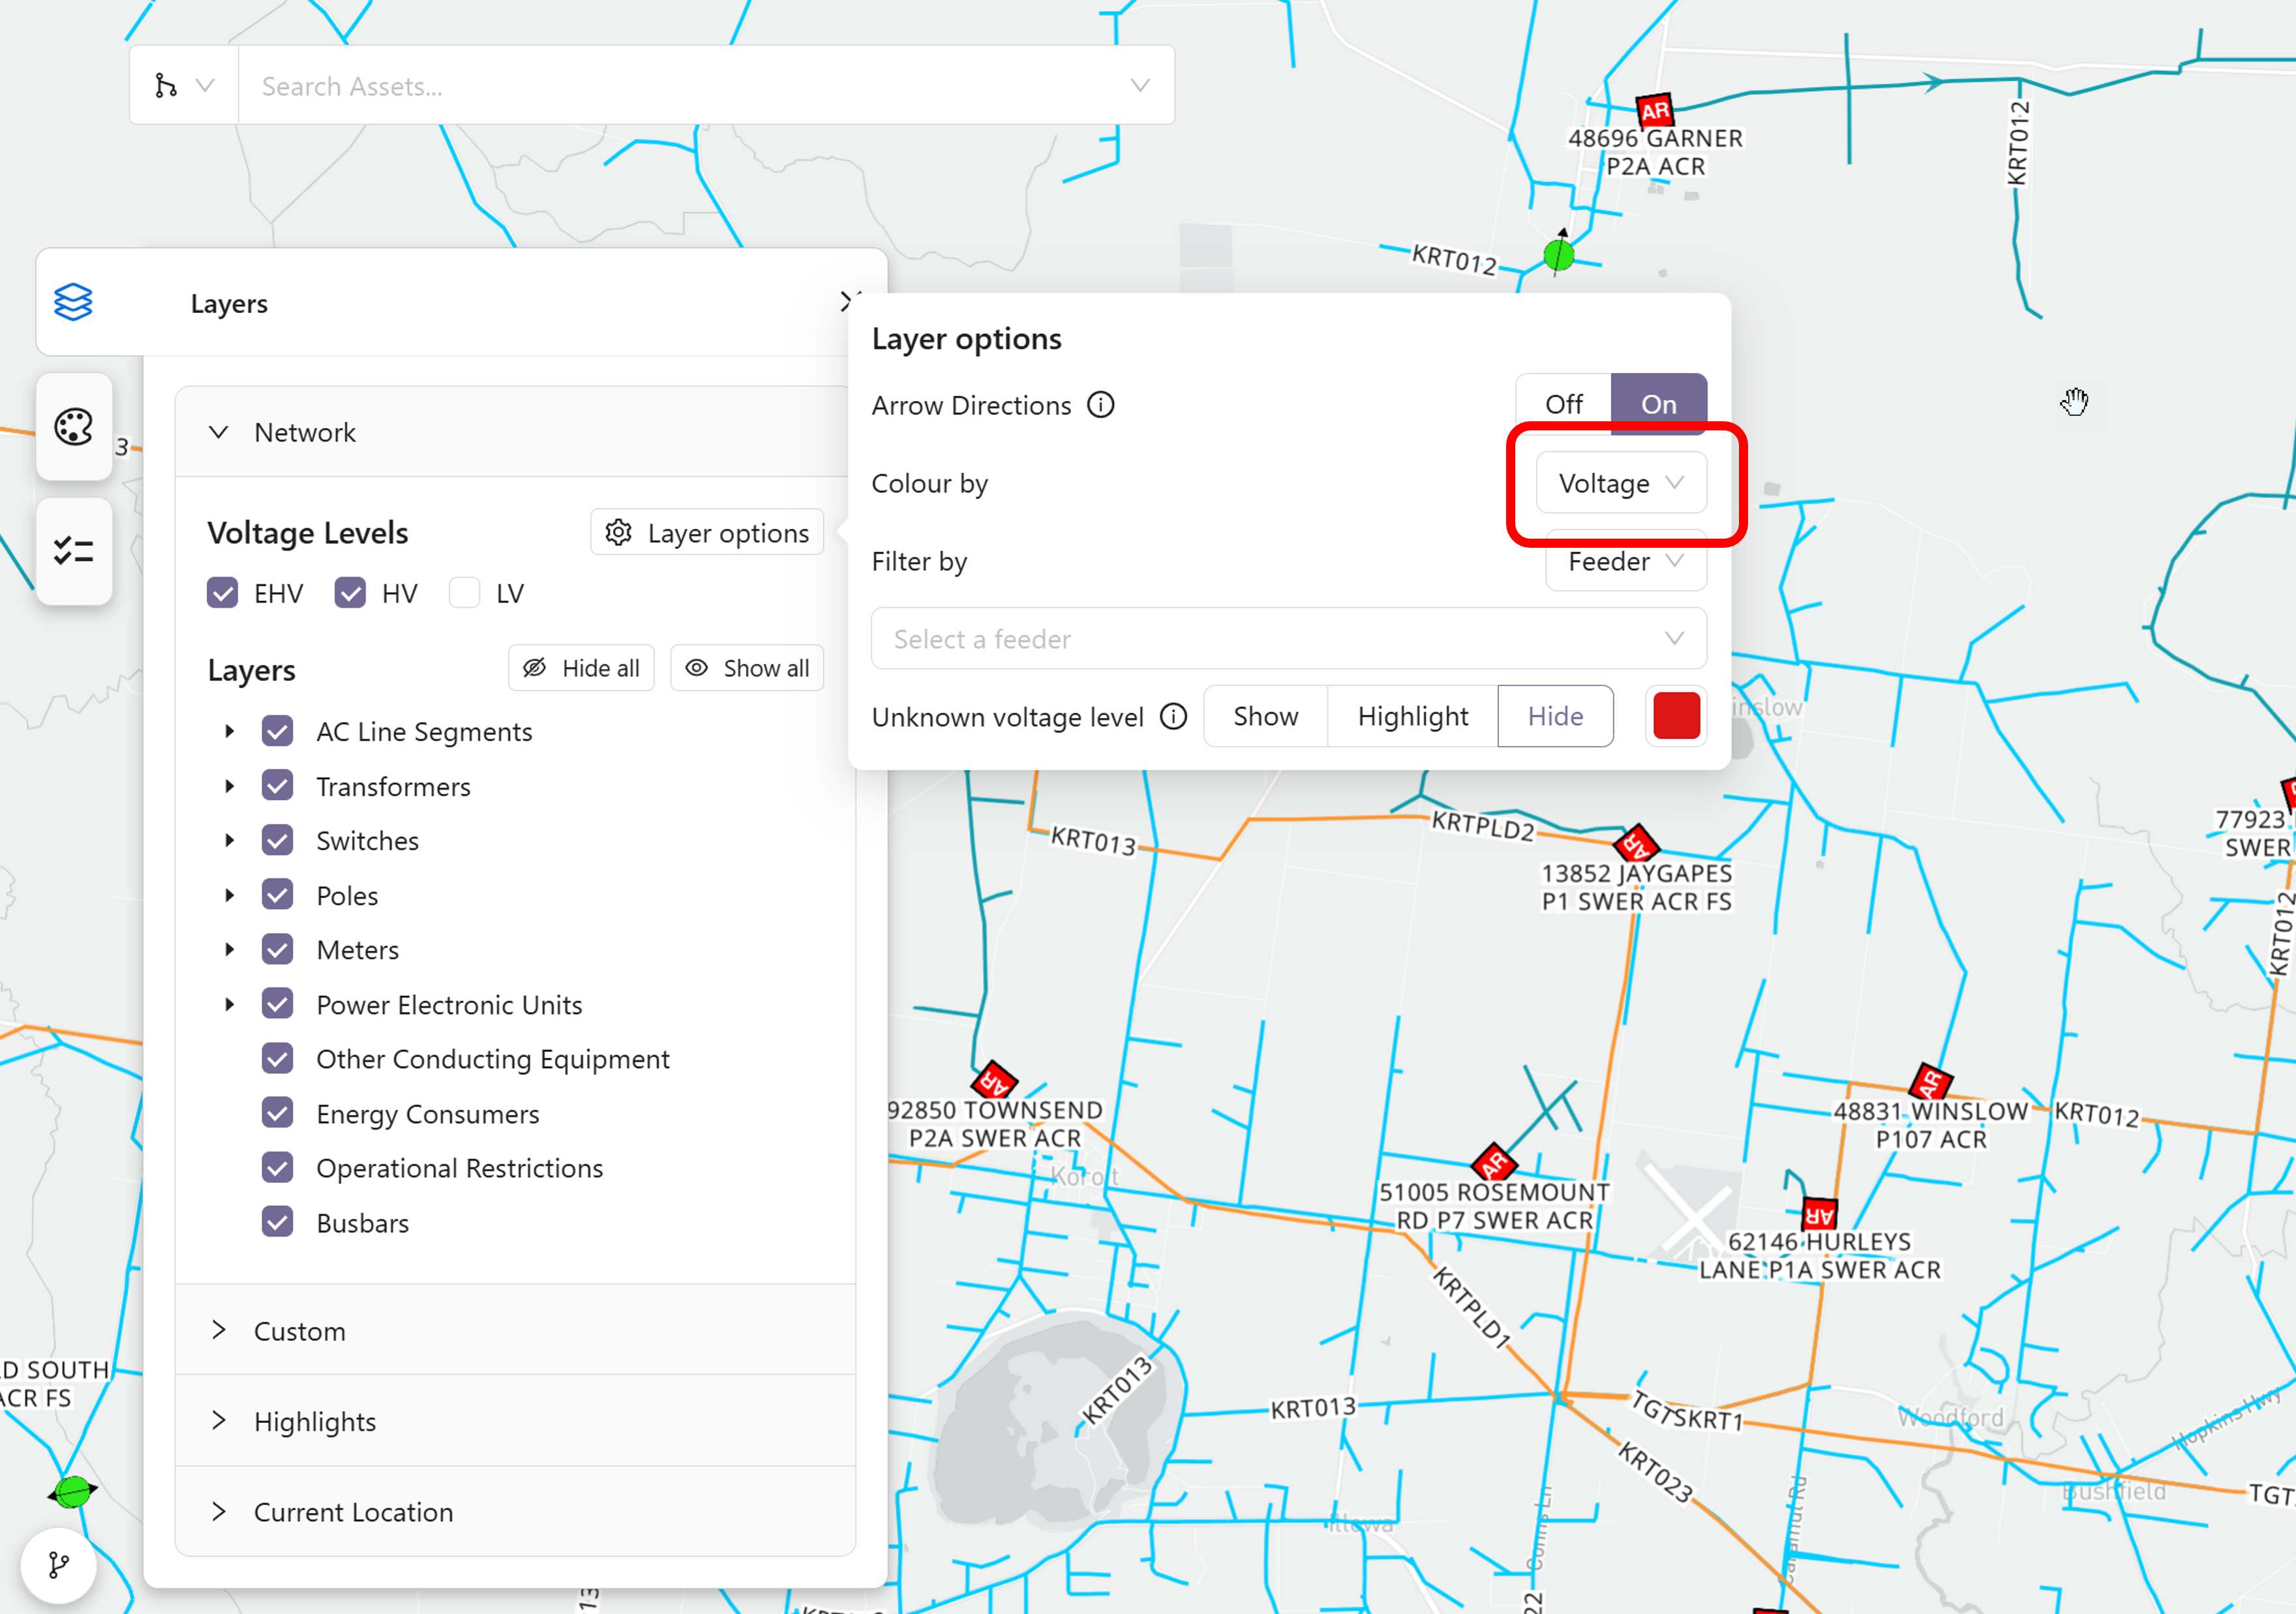
-
Voltage: This colours the conductors by their actual operating voltage – noting that multiple voltages can be present within the same voltage level. The colour for each voltage is configurable by the system administrator. In the screenshot below, there are two network voltage levels turned on (EHV and HV) but three different voltage colours, providing an example of multiple operating voltages at the same network voltage level.
-
HV Feeder: This colours the conductors according to the HV feeder they are contained within in the HV and LV network voltage levels, or the circuit they are contained within for the EHV network voltage level. There are 14 colours that have been chosen to provide good contrast between each feeder or circuit. They are assigned to each feeder or circuit based on an algorithm that picks the colour from the name of the feeder or circuit. Meaning that, as long as the name of the feeder or circuit does not change, the colour of each feeder or circuit will remain the same as the network changes over time. Because there can be many more than 14 feeders and circuits in a typical network, the colours are not unique for each feeder and circuit.
Also, conductors and bus bars within Zone Substations all have the same colour (red) when the colour by -> HV Feeder option is enabled, because the assets within a zone substation are not a part of any particular feeder or circuit. In the screenshot below, examples of both HV Feeders and EHV Circuits can be seen with different colours. Note that the name of the feeders and circuits can also be seen as labels on the conductors.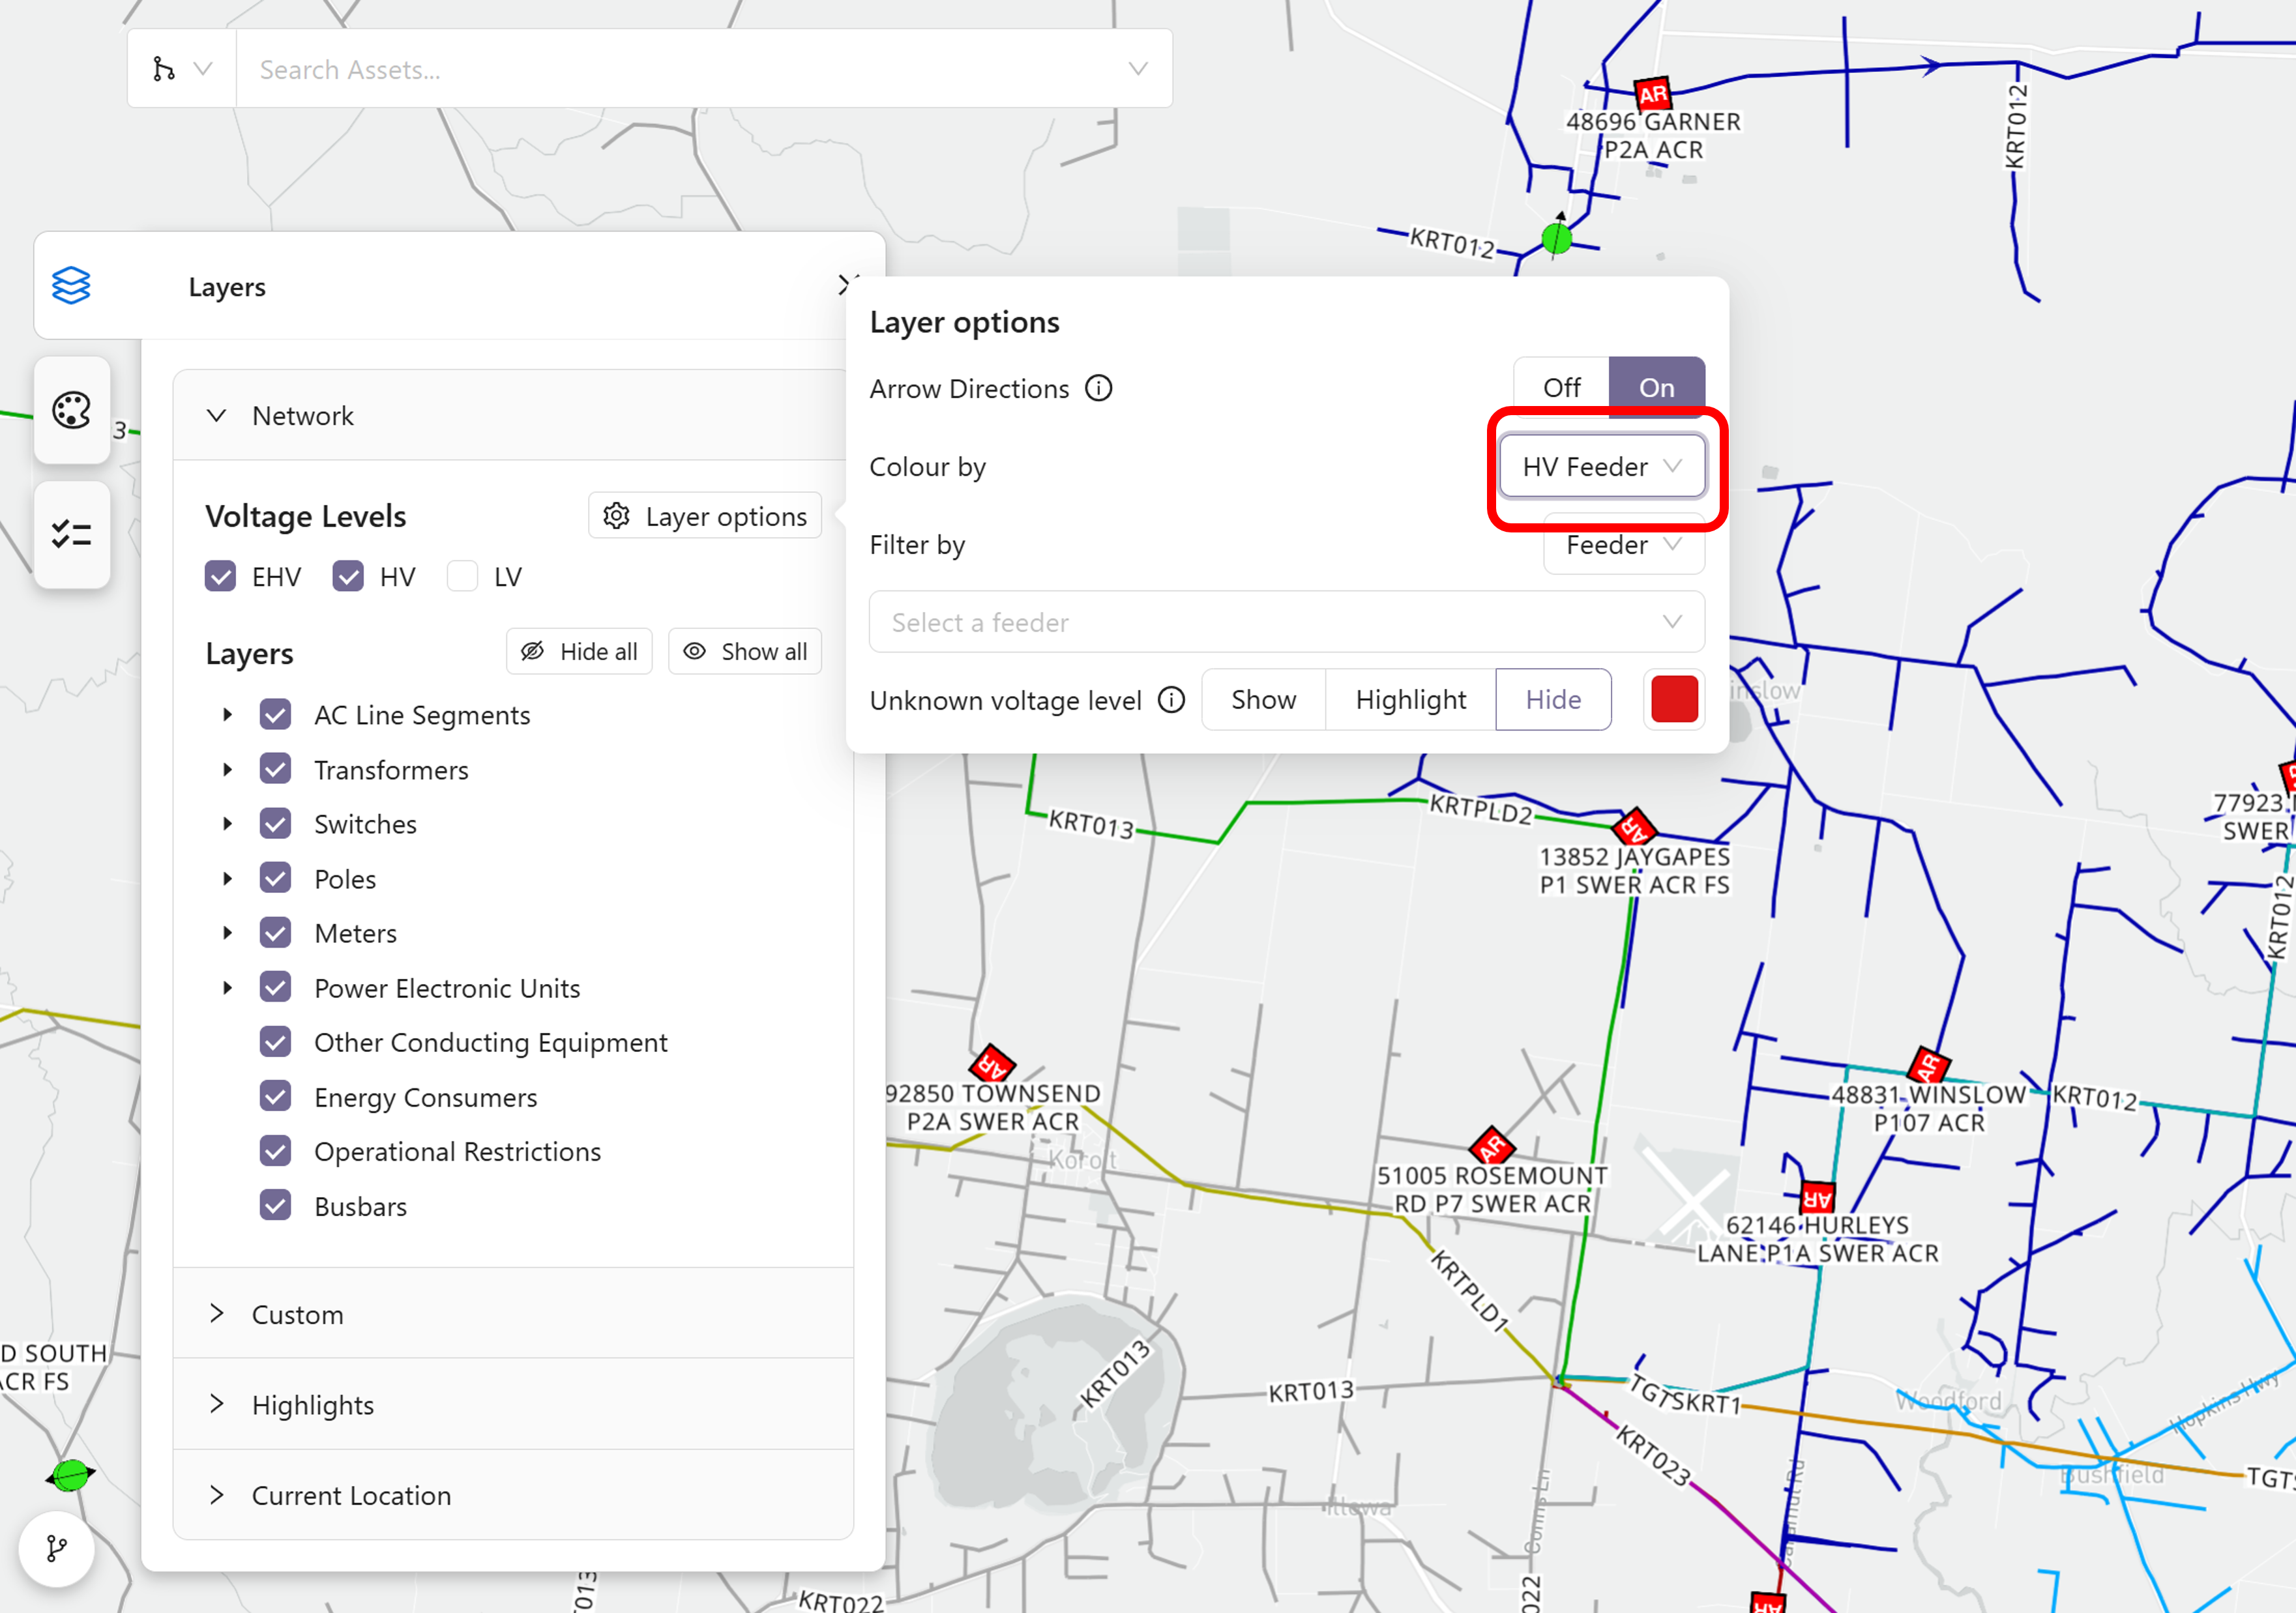
-
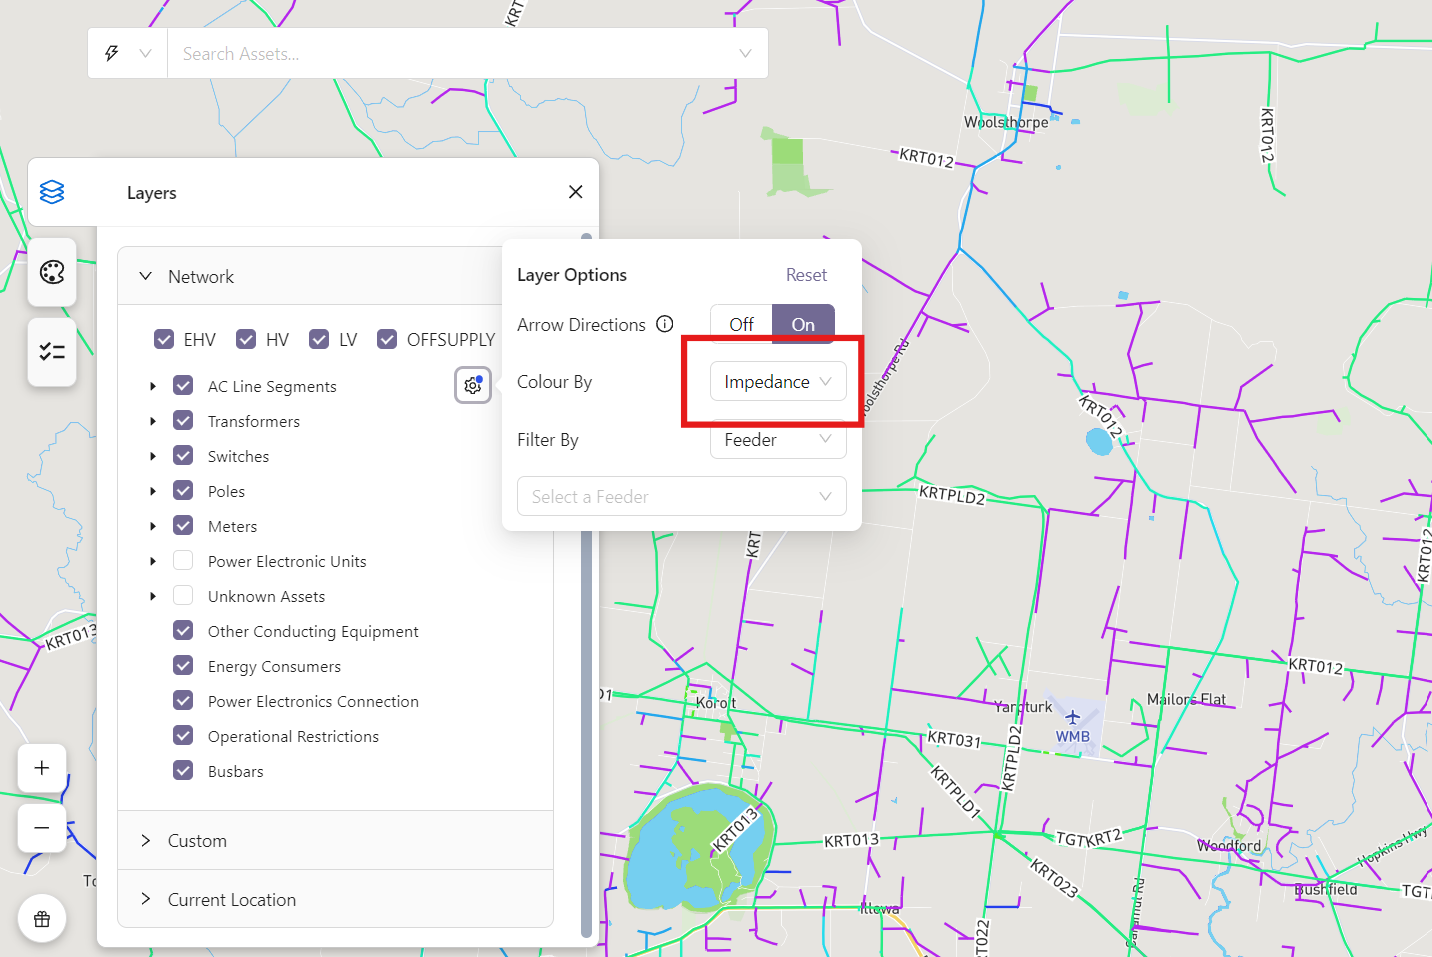
Impedance: This colours the conductors by their impedance. Conductors whose impedance is within a defined range of reasonable values are assigned a colour within a gradient between 2 colours that correspond to the minimum and maximum reasonable impedance respectively. Special colours are used in cases where the impedance of a line is missing, null, zero, or outside the defined range. In the screenshot below, greener lines indicate lower impedance and bluer lines indicate higher impedance.
Filter by
The “Filter by” drop down provides a way of showing:
- All assets connected to all feeders starting at a particular Zone Substation
- All assets connected to a particular HV Feeder
- All asset connected to a particular EHV Circuit.